Making Google Sheets look less like… Google Sheets

This is a guest post from Josh Cottrell-Schloemer.

Google Sheets is an incredibly powerful spreadsheet tool for pulling, processing, and presenting data. But many people don’t realize that you can also use it to build interactive dashboards.

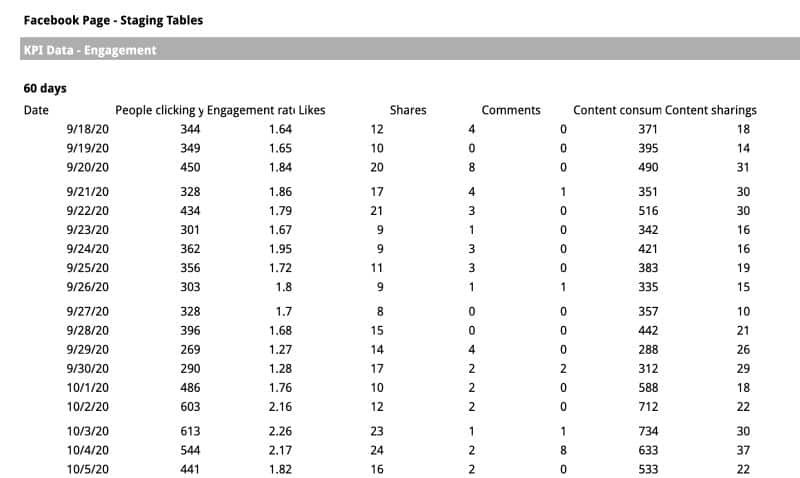
With a bit of creativity we can go from this:
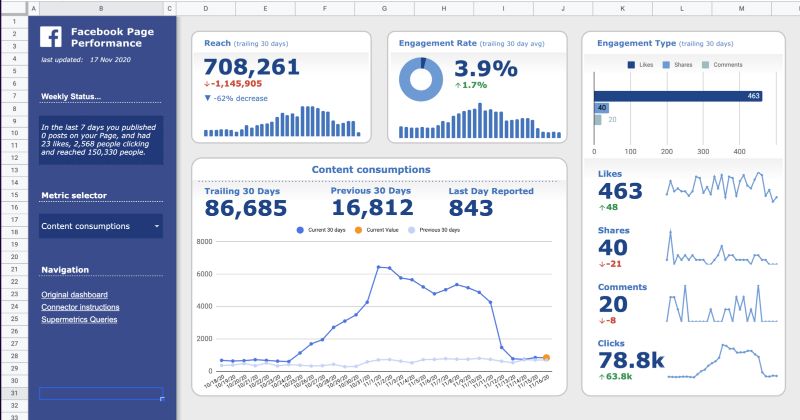
Dashboard Data Table in Google Sheets

To this:

Google Sheets Dashboard

The skills to build this type of dashboard aren’t difficult to learn and you can get started with a basic knowledge of Google Sheets.

Here’s a walkthrough of the dashboard shown above:


Continue reading Making Google Sheets look less like… Google Sheets

6 advanced techniques to master in Google Data Studio

Google launched a new business intelligence tool called Data Studio in May 2016. It’s a really smart reporting tool for quickly creating powerful, stunning dashboards from multiple Google data sources.

It’s a great option for small/medium businesses already using Google tools, who want to build bespoke dashboards for that 40,000ft view of their business.

Google Data Studio Example Reports

Here are two example reports for a mid-size website (~500k pageviews a month).

Firstly, a mobile performance dashboard:

Data Studio Mobile Performance Dashboard Continue reading 6 advanced techniques to master in Google Data Studio