Welcome to issue 4 of the Sheets Insiders membership program.
You can see the full archives here.
In this issue, we’re looking at AI tools and using them for data analysis and generating formulas.
It’s a fascinating time to work with these tools. They’re changing and improving on a weekly basis, so whether you’ve tried them or not, it’s worth checking in frequently.
As you’ll see below, the tools are useful as assistants. They’re not ready to replace us (yet!) because they still struggle with seemingly simple requests (change this column chart to a bar chart) and make mistakes (e.g. formulas that give errors). So you have to treat them as just-another-tool, and not put them up on a pedestal.
But they’re incredibly good at surfacing insights quickly from big datasets. And they can dramatically speed up your workflows.
§TL;DR
- Current AI tools are competent at data analysis and generating formulas.
- But they are best thought of as assistants. You still need to do the work.
- Best approach is an iterative one, approaching problems step-by-step.
- Don’t be lazy! Suggested prompts are helpful but are not a substitute for your own critical thinking.
- Gemini and ChatGPT did similarly well with formulas and data analysis. It was hard to pick a winner.
- Julius AI was impressive for data analysis tasks.
Prompt tips
- Be specific with your instructions, e.g. say “in Google Sheets” in your prompt to ensure that the AI uses Google Sheets specific functions.
- Include data or images to show example inputs and, where possible, expected outputs.
- Copy-paste error messages, e.g. “that gives me a #VALUE! error: Function SPLIT parameter 2 value should be non-empty”.
- Share results back with the AI tool and iterate.
- Split complex problems into steps and verify each step
§ AI + Sheets Experiment Details
Introduction
For this email I looked at four tools (Gemini in Sheets, Gemini in a browser, ChatGPT, and Julius) and focused on data analysis and formula generation.
Using a dataset with Spotify songs, I started by asking the tools to “tell me about this dataset” before trying progressively more challenging analysis questions.
For the formula generation, I used the seven formula challenges from my newsletter to see how AI tools would fare. I’ve shared the results in the formula template below.
Tools
I’m using the following tools:
- Gemini in Google Sheets (currently available for Workspace Labs & Alpha users)
- Gemini in my browser (I’m using the paid version of Gemini, called Gemini Advanced)
- ChatGPT with the model 4o
- Julius.ai a dedicated data analysis AI tool (more on this below)
Templates
1. Spotify Most Streamed Songs Dataset (dataset only)
(Source: Kaggle)
Feel free to make your own copy.
You may be able to add your Google Sheet files directly into the AI tool by setting the sharing access to “Anyone with the link”.
If that doesn’t work, download a CSV file from your Google Sheet and upload that to the AI tool: File > Download > Comma Separated Values (.csv)
2. Sheets Insiders 4: AI Formula Testing
Feel free to make your own copy.
Data Analysis Experiments
For these data analysis experiments, I used the Spotify Most Streamed Songs dataset (link above).
Gemini in Google Sheets
Using the Gemini in Google Sheets sidebar was a seamless experience. The prompt window is embedded in your Sheet so there is no disconnect between your Sheet and the analysis.
I started with this prompt:
“tell me about this dataset”
Gemini generated a few paragraphs and bullet points summarizing the data. Nothing groundbreaking but it’s a nice quick way to get a sense of the dataset.
Behind the scenes, the AI tool interprets your prompt and generates Python code for the analysis. You can view and copy this python code, although you can’t modify it.
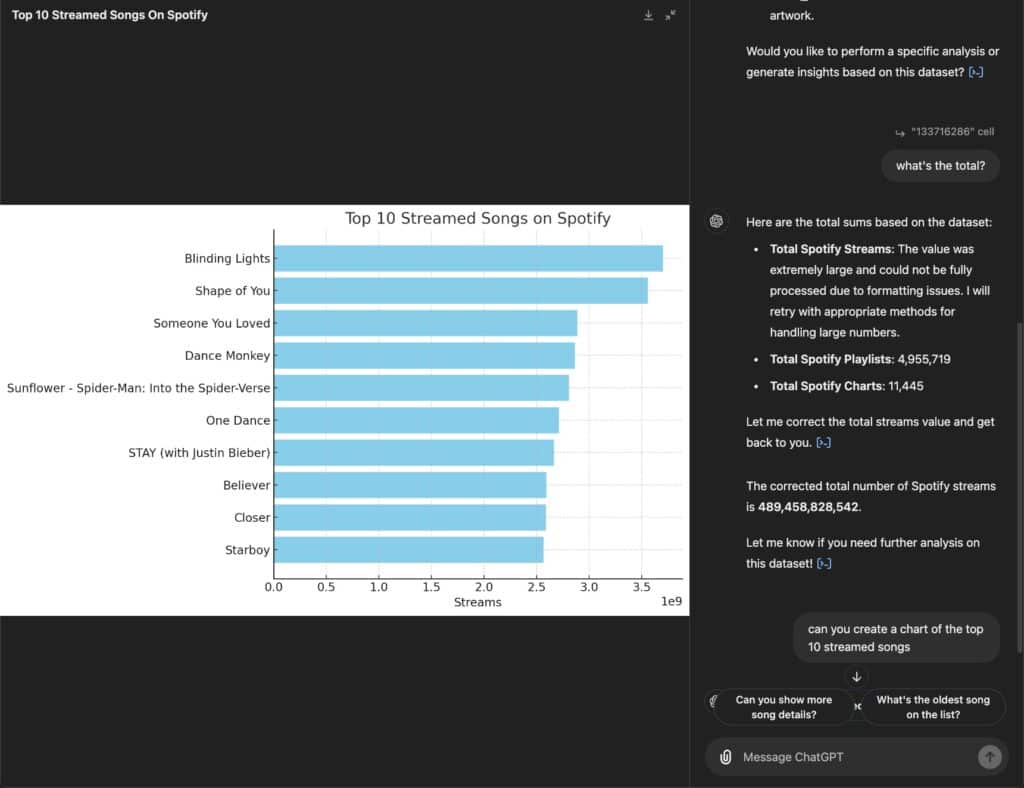
It’s able to create charts from your data. I used the prompt “can you create a chart of the top 10 streamed songs” to create this chart:
Gemini correctly dealt with the bogus text string in the stream numbers column.
I followed up with the prompt:
“can you update the top 10 streamed songs chart to be a bar chart not a column chart and sort it descending from highest to lowest?”
but it was not able to do this.
Unsurprisingly, Gemini running in the browser gave similar results and also failed to change the column chart into a bar chart.
ChatGPT
ChatGPT fared similarly well on the data summary question.
And it did a slightly better job generating charts. It picked a bar chart, which was a better choice for this chart because the labels are long. It also automatically sorted the data descending, which makes for easier comparison:
Julius AI
Julius.ai is a dedicated AI-powered data analysis tool. I’m just starting to use this tool and it’s very impressive.
It’s easy to upload a Google Sheet with the sharing URL:

Julius.ai converts Google Sheets to Excel files (so this could create issues with formulas that are not compatible).
It generates python code and explains the answers with lots of detail.
It handles more complex questions, such as “can you tell me whether artists that collaborate have more success than solo artists?”
It gives a detailed statistical response to your questions and generates sleek visualizations, like this violin plot:
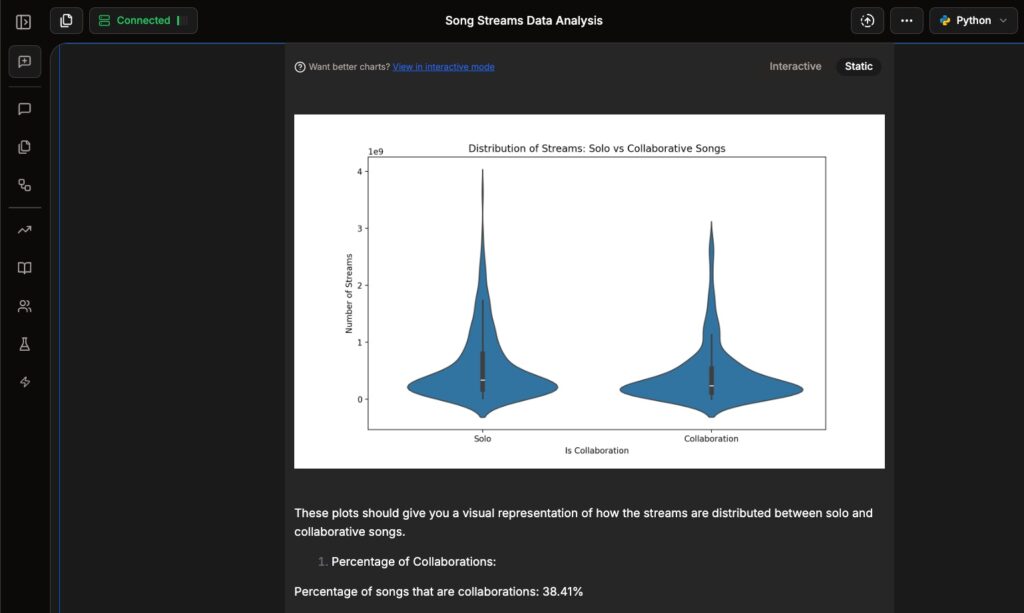
I was encouraged by how thorough and useful the responses were.
You can also create workflows in Julius to automate repetitive data analysis tasks.
Formula Generation Experiments
Gemini
Gemini did an excellent job on the seven formula challenges. It got most of the answers correct, and with fewer iterations that ChatGPT.
In fact, Gemini surprised me with how well it did, getting several of them correct on the first try.
And with Gemini in Google Sheets, the sidebar has an “Insert” button.
So when it generates a formula, you can insert it directly into the active cell of your Sheet with a single click. This is a much nicer workflow that copying and pasting from a different browser window.
ChatGPT
ChatGPT required more hand-holding that Gemini to get answers to the seven formula challenges.
I also tried ChatGPT with this prompt to generate formulas for the Spotify dataset:
“This data is in a Google Sheet. What is the formula to show the top 10 streamed songs rows?”
ChatGPT got the answer first time:
=ARRAY_CONSTRAIN(SORT(A2:J, J2:J, FALSE), 10, 10)
And it got my next formula question correct:
“can you do it with the filter function?”
=FILTER(A2:J, J2:J >= LARGE(J2:J, 10))
But it couldn’t get the follow up question correct:
“can you modify this formula to sort descending by stream count?”
So I asked GPT to try a different approach:
“are there any other approaches you can think of? Using different functions”
This led to another correct solution using the QUERY function:
=QUERY(A1:J, "SELECT * ORDER BY J DESC LIMIT 10", 1)
Julius AI
This did not fare well with these formula challenges. It’s more suited to data analysis and statistics.
§ Summary
These AI tools are incredibly useful exploratory tools. They’re great to uncover insights quickly, that we might otherwise overlook.
It’s amazing how far the technology has come this year. When I recorded my AI + Sheets course last year, the tools could only handle basic formula questions. Now, Gemini and ChatGPT are returning solutions first-time for complex problems.
But it’s still super important to do the work yourself and not just rely on the output of an AI black box.
After using AI tools, I’m left pondering two questions:
- Does it make us lazy?
- Do we understand the findings?
Does it make us lazy
Using these tools, it’s too easy to stop thinking and blindly click on the suggested prompts (e.g. “show more”).
This hands over critical thinking to the tool.
There’s nothing wrong with using these prompts—and I think they can be tremendous time savers for exploring data—but we can’t do it to the exclusion of our own critical thinking.
After all, we’re the ones trying to solve the problem. The AI tool doesn’t care.
Do we understand the findings
When the tool gives us insights or creates charts, it takes time to understand and interpret these results.
But it’s easy to skip this and only take a cursory glance at the results. At best this leaves us with only a surface-level understanding of what’s going on.
When we do the analysis ourselves, we have a much deeper understanding of the data and the insights. Because we’ve thought about it much harder.
So it’s important to still do the work ourselves. And use these tools as we use any other tool. To make our jobs easier and faster.
—–
Undoubtedly though, this is the direction we’re headed whether you like or not. It won’t be long until we’re conversing with our spreadsheets via the chat interface (even using our voices!) as the primary input method, rather than directly typing formulas or code ourselves.
This puts a premium on our critical thinking skills rather than our ability to remember obscure formula syntax, which can only be a good thing!