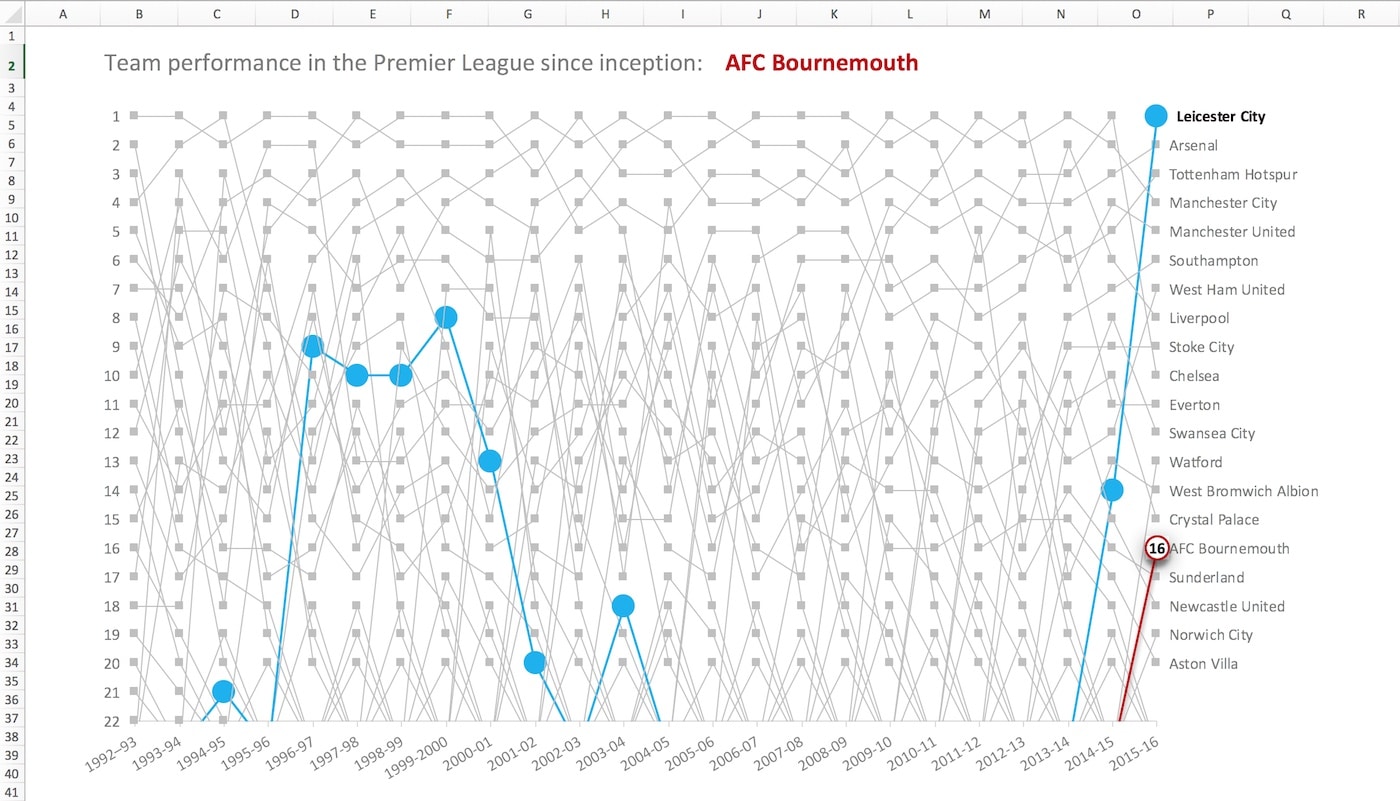
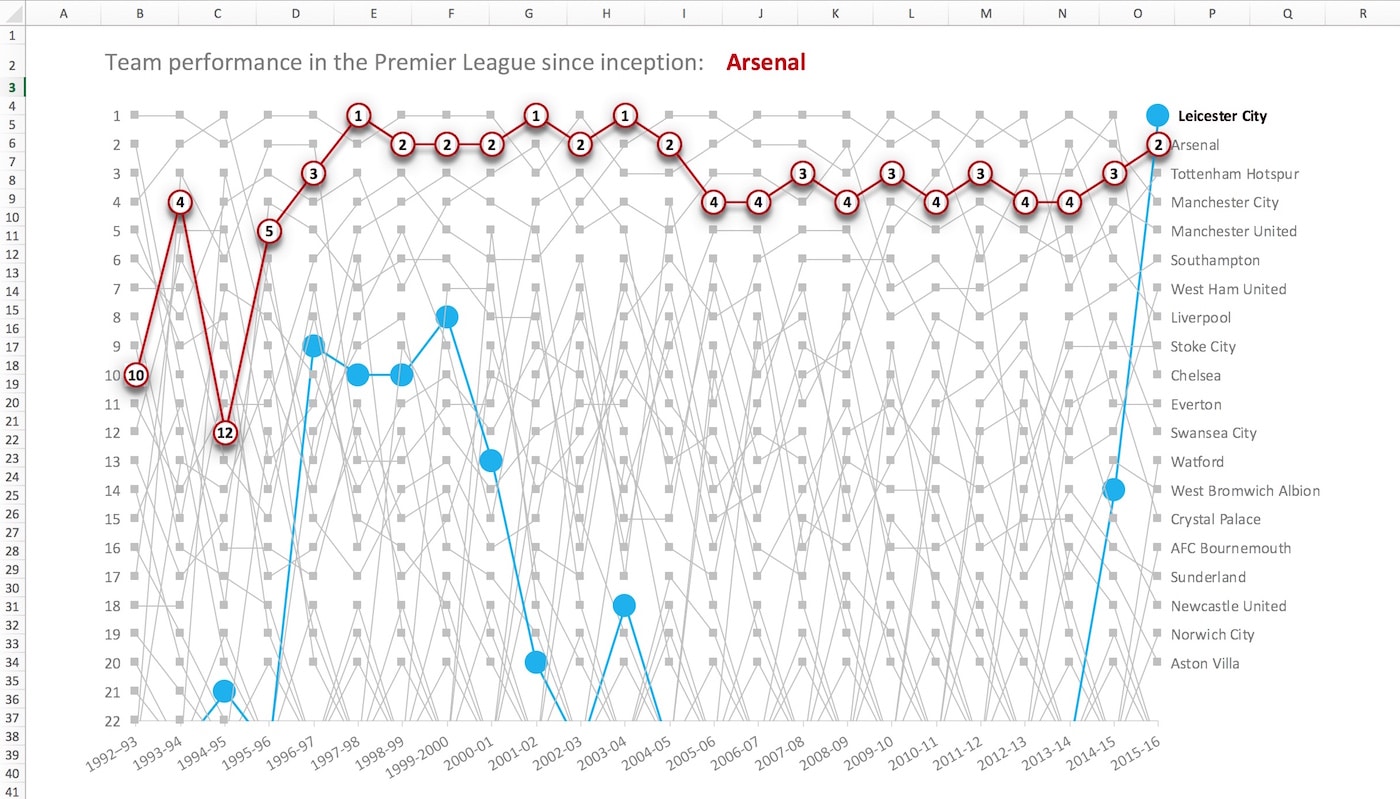
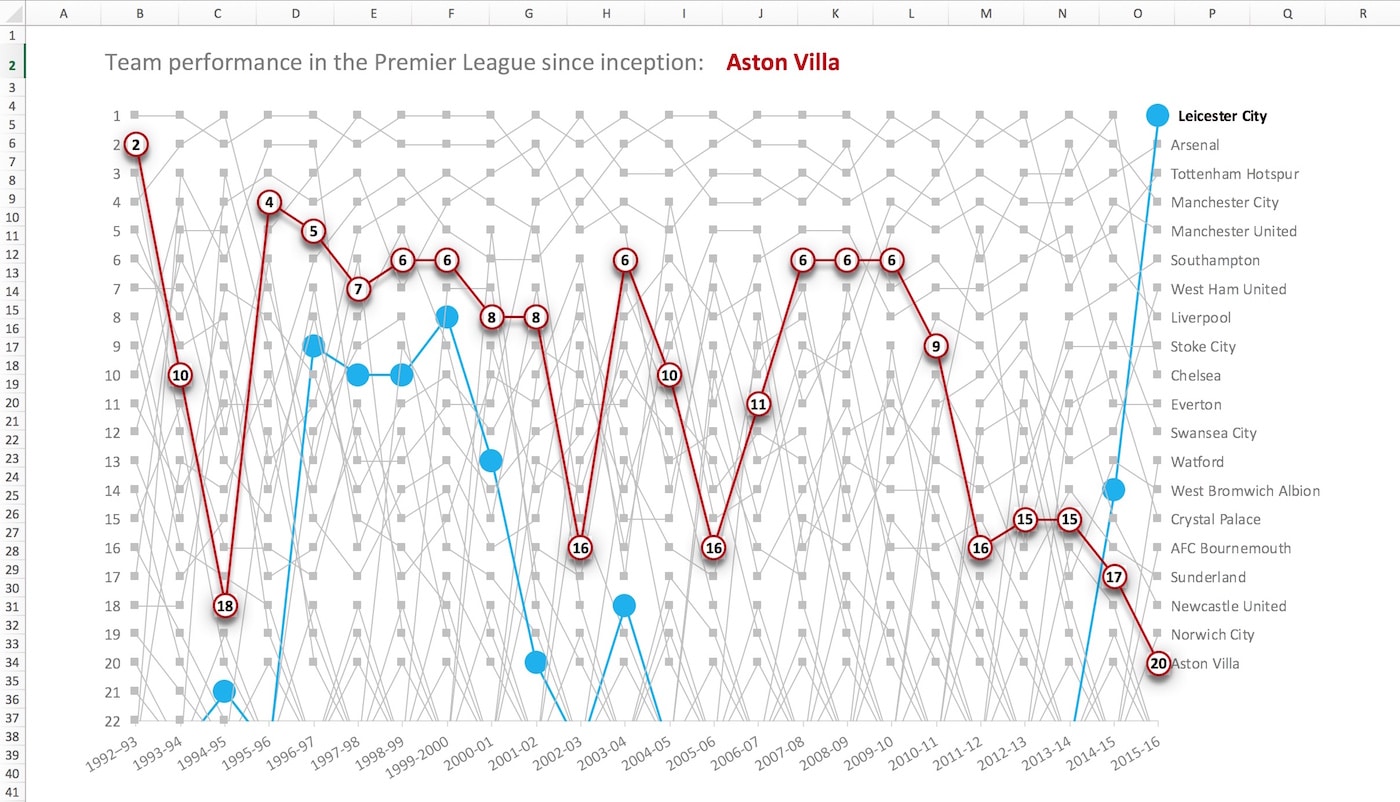
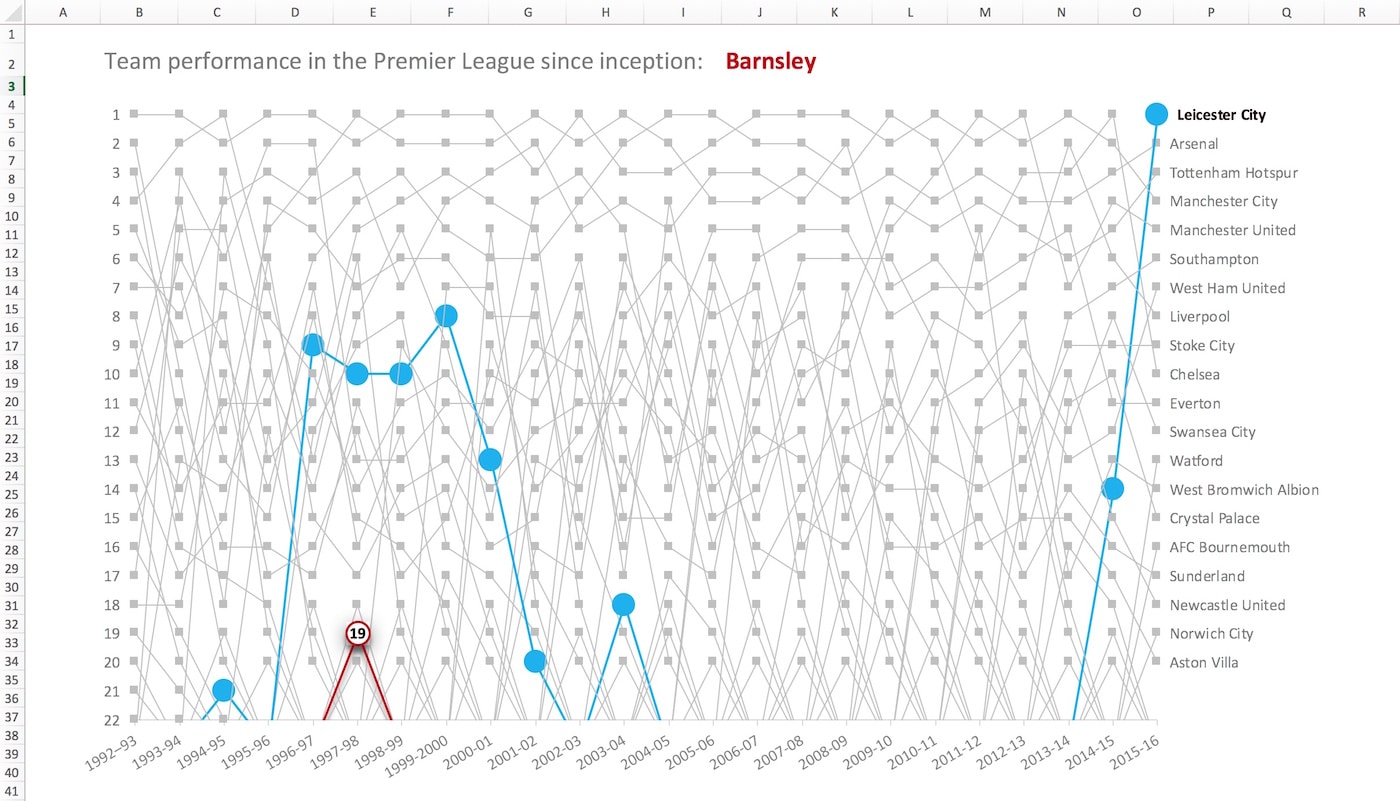
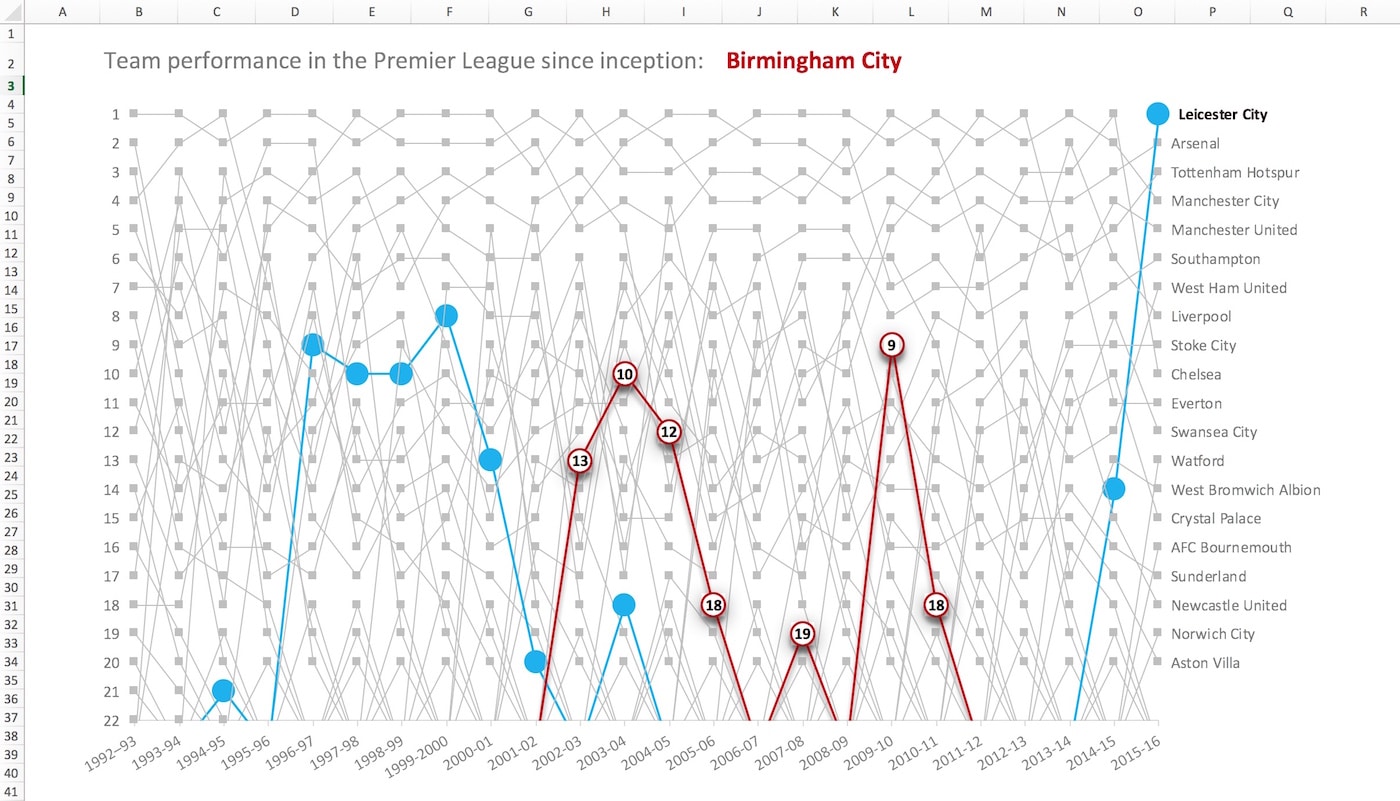
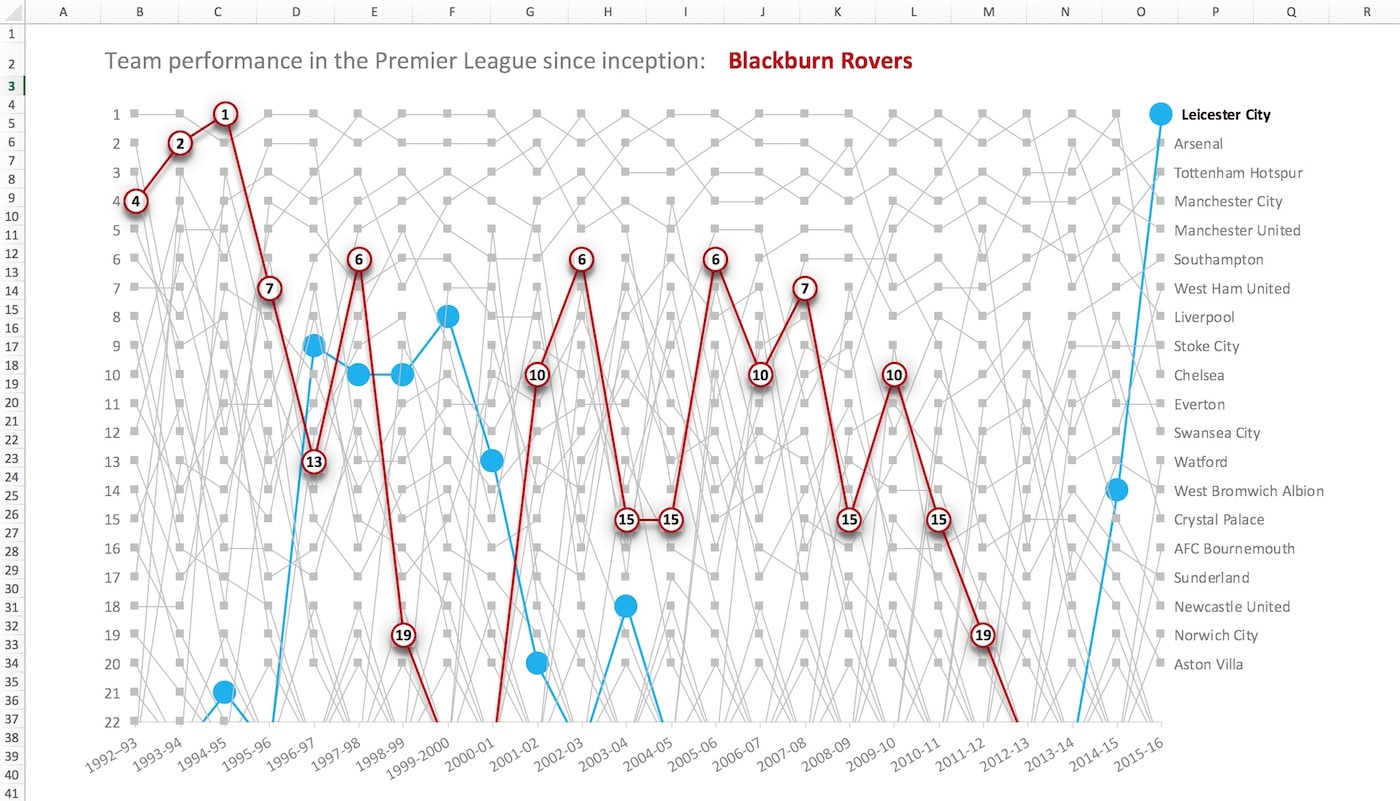
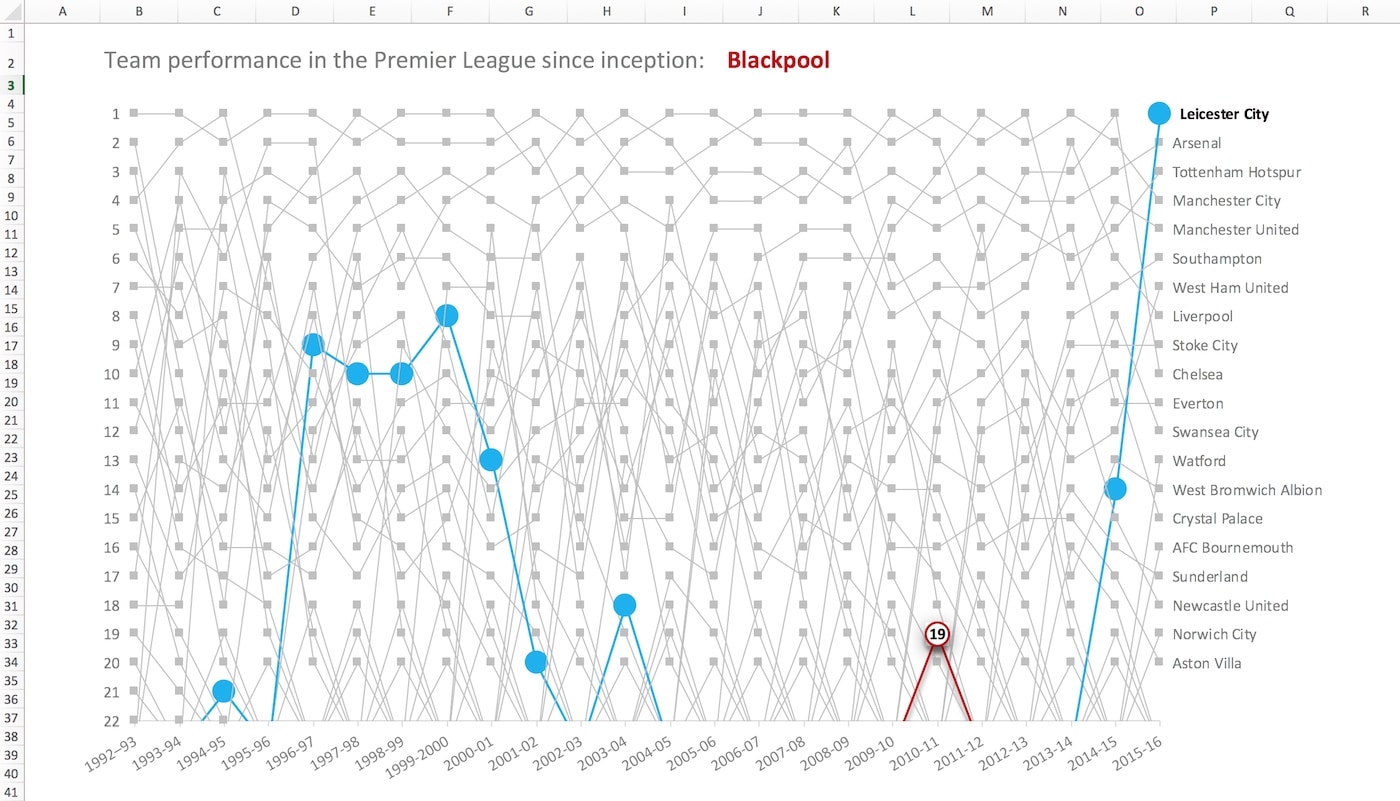
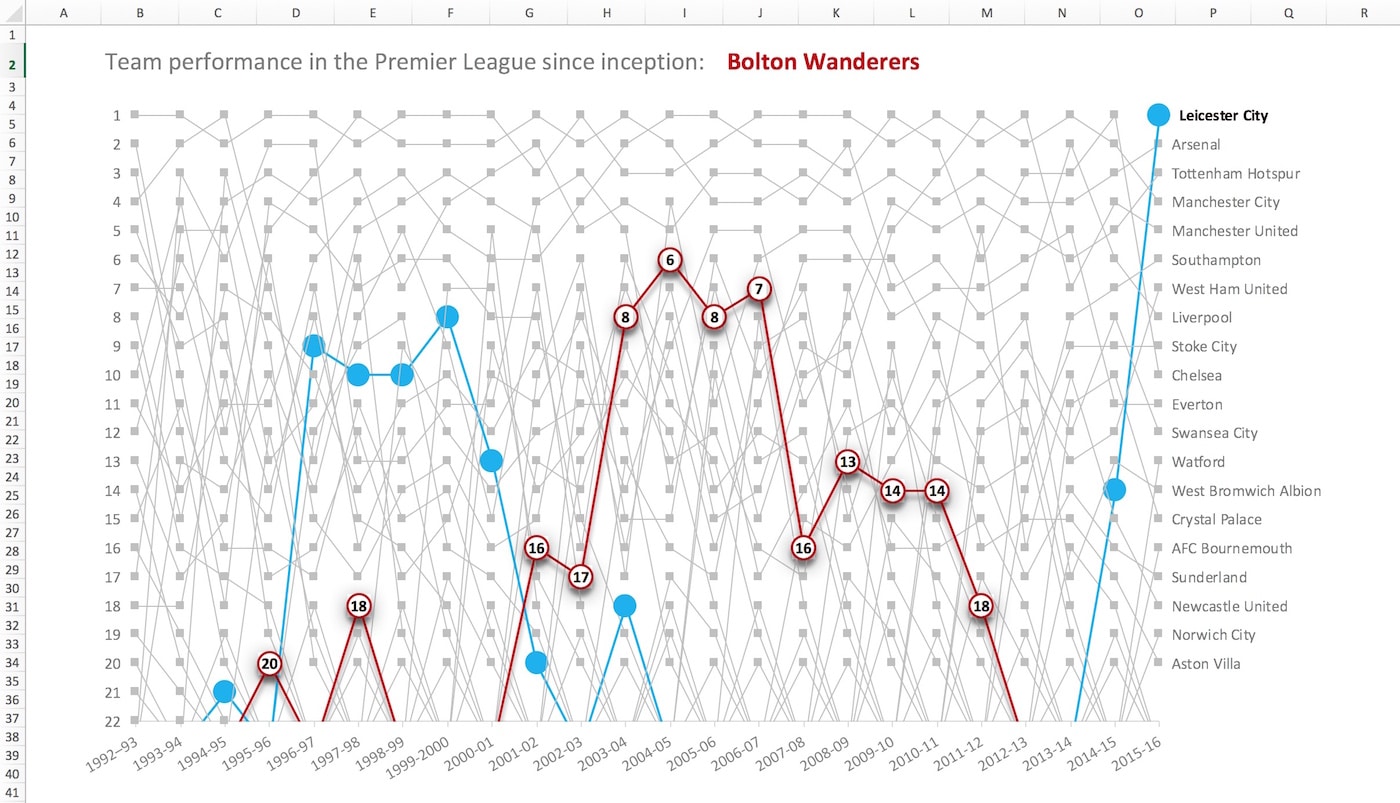
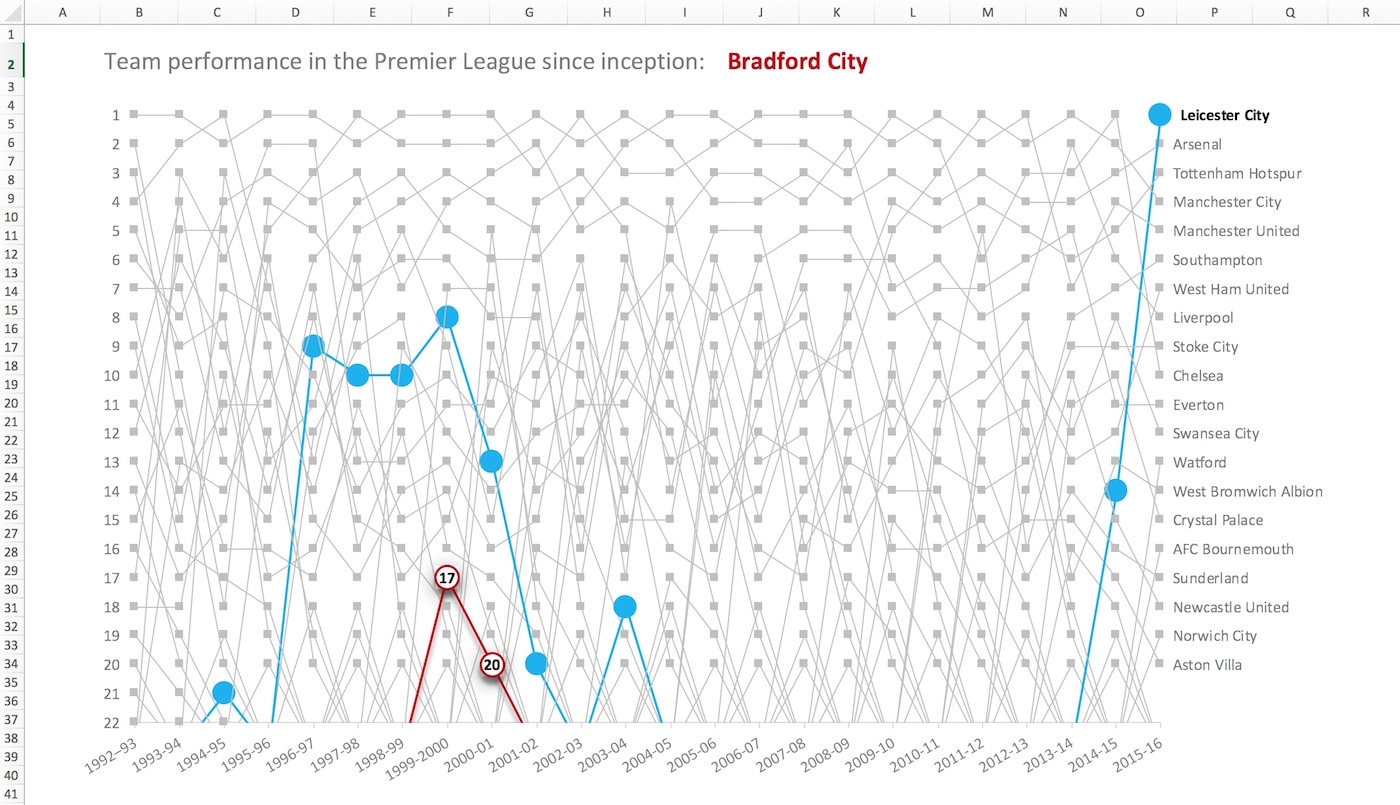
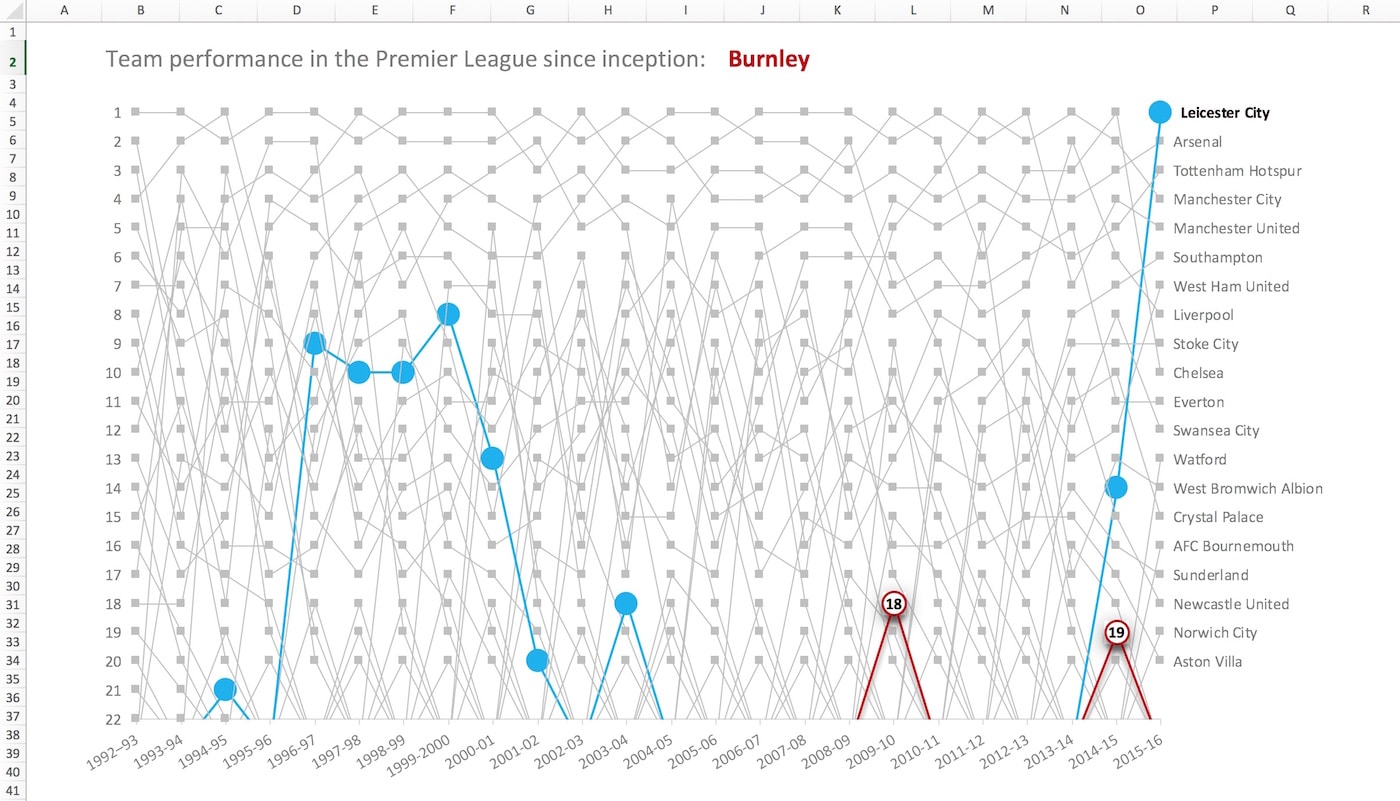
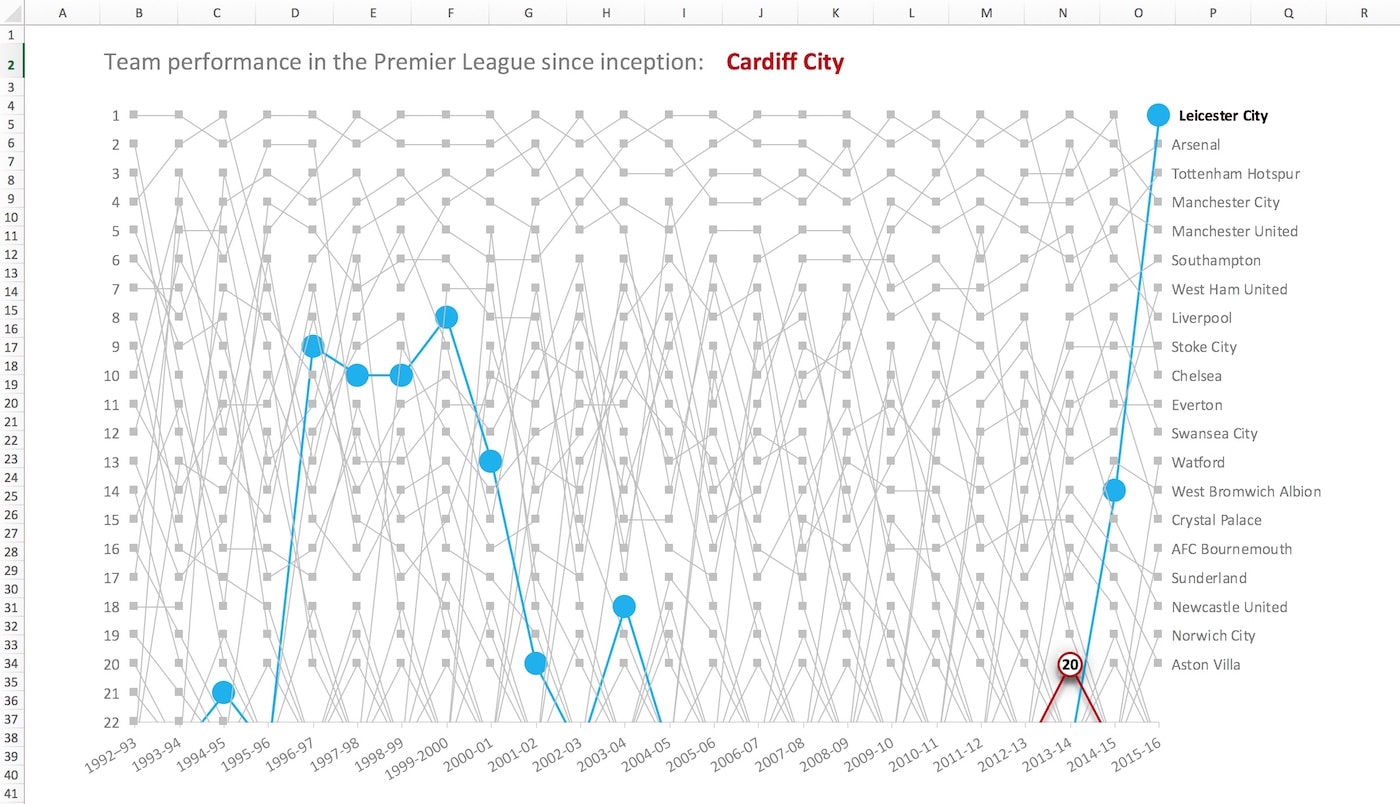
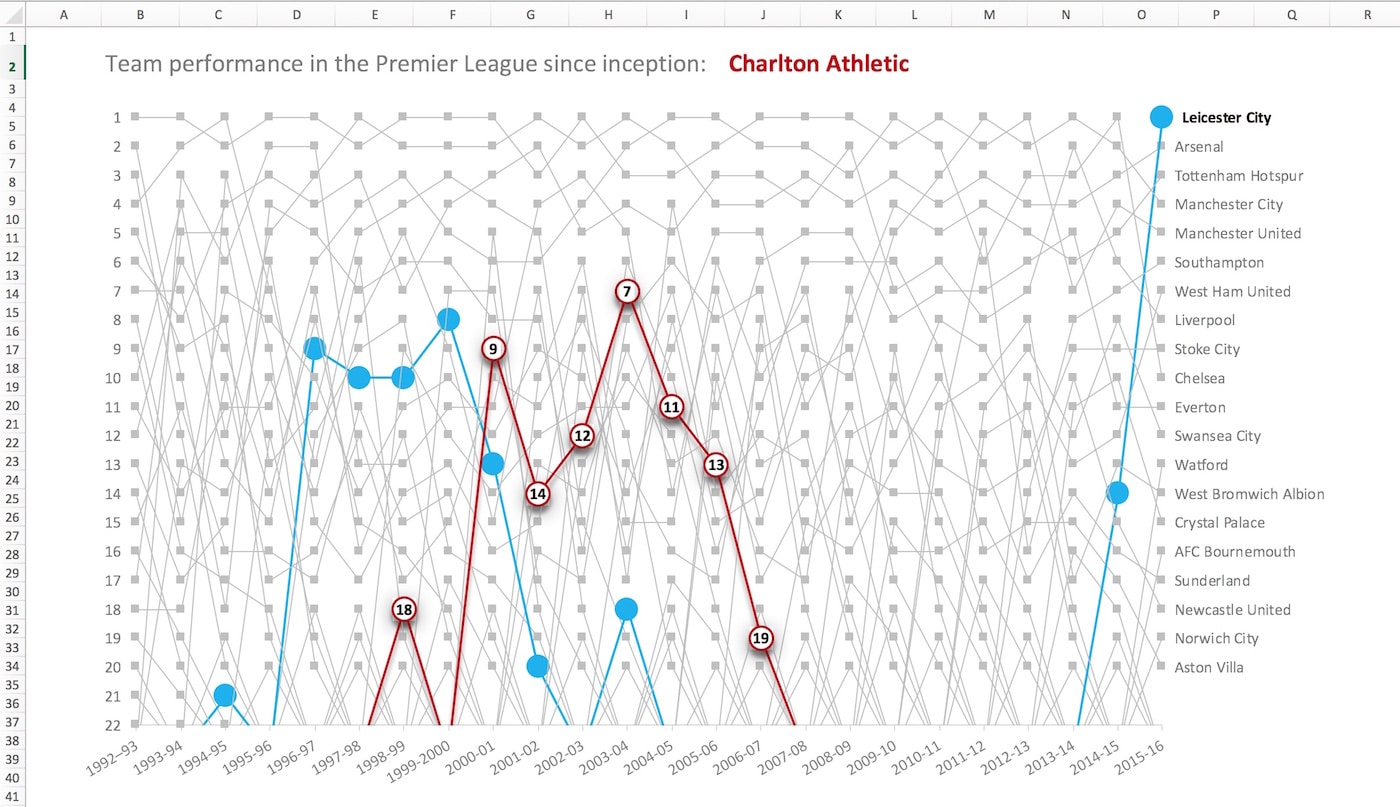
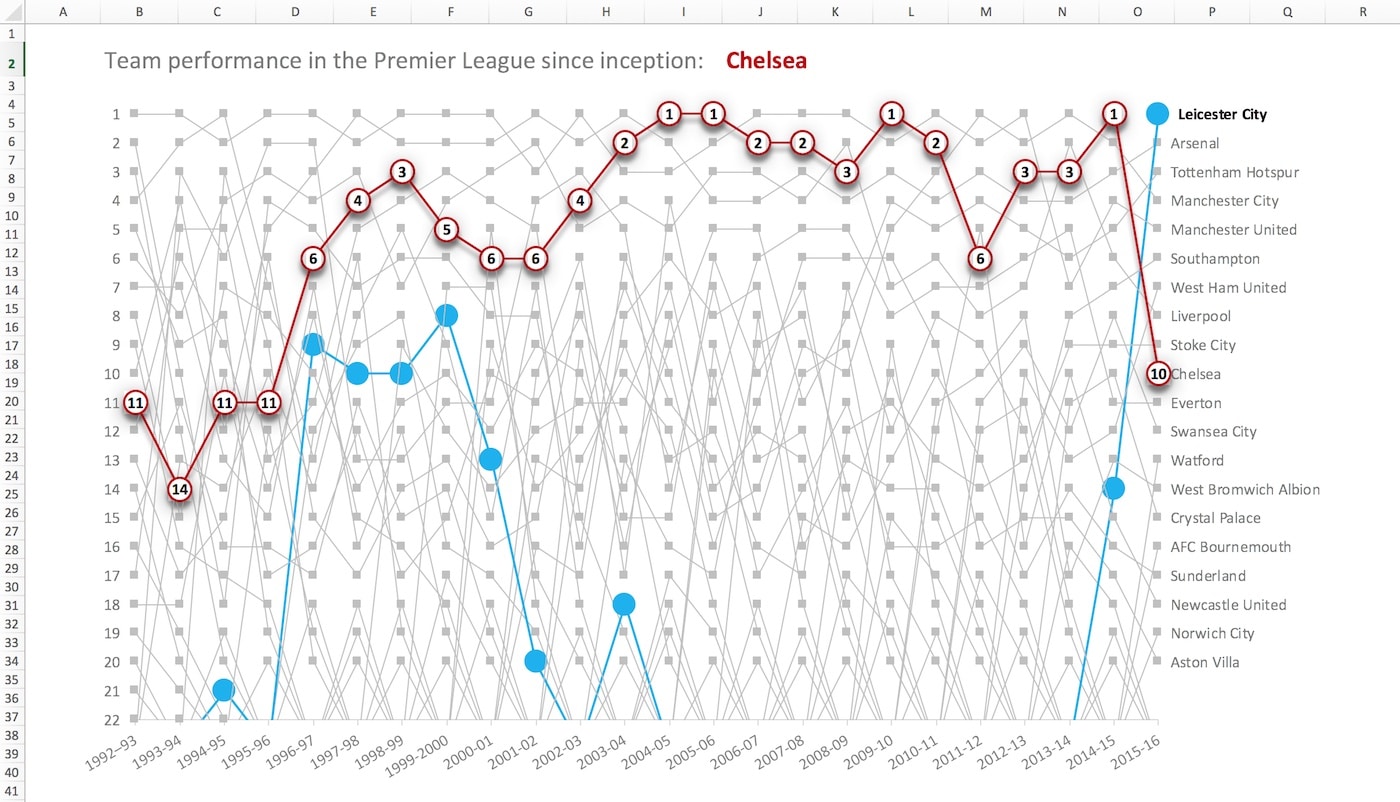
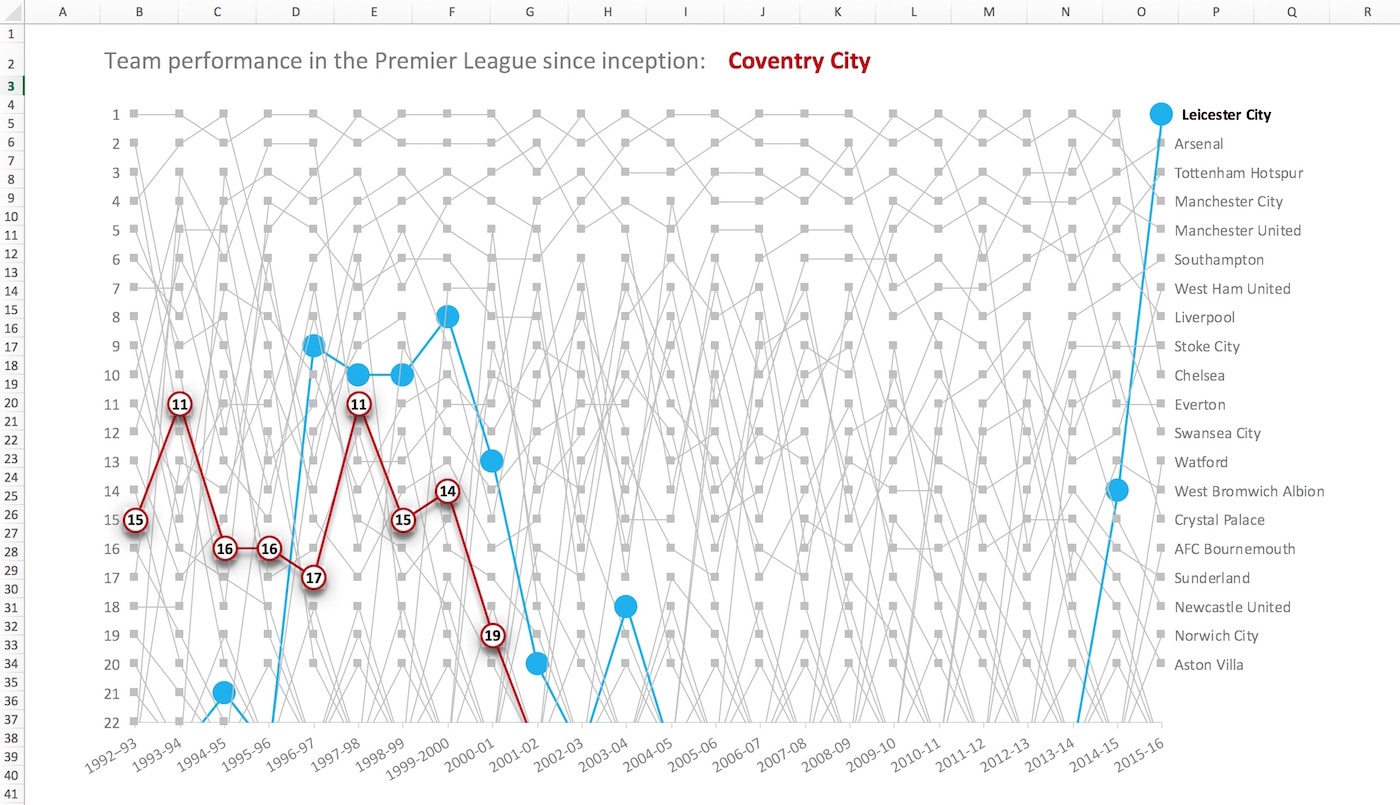
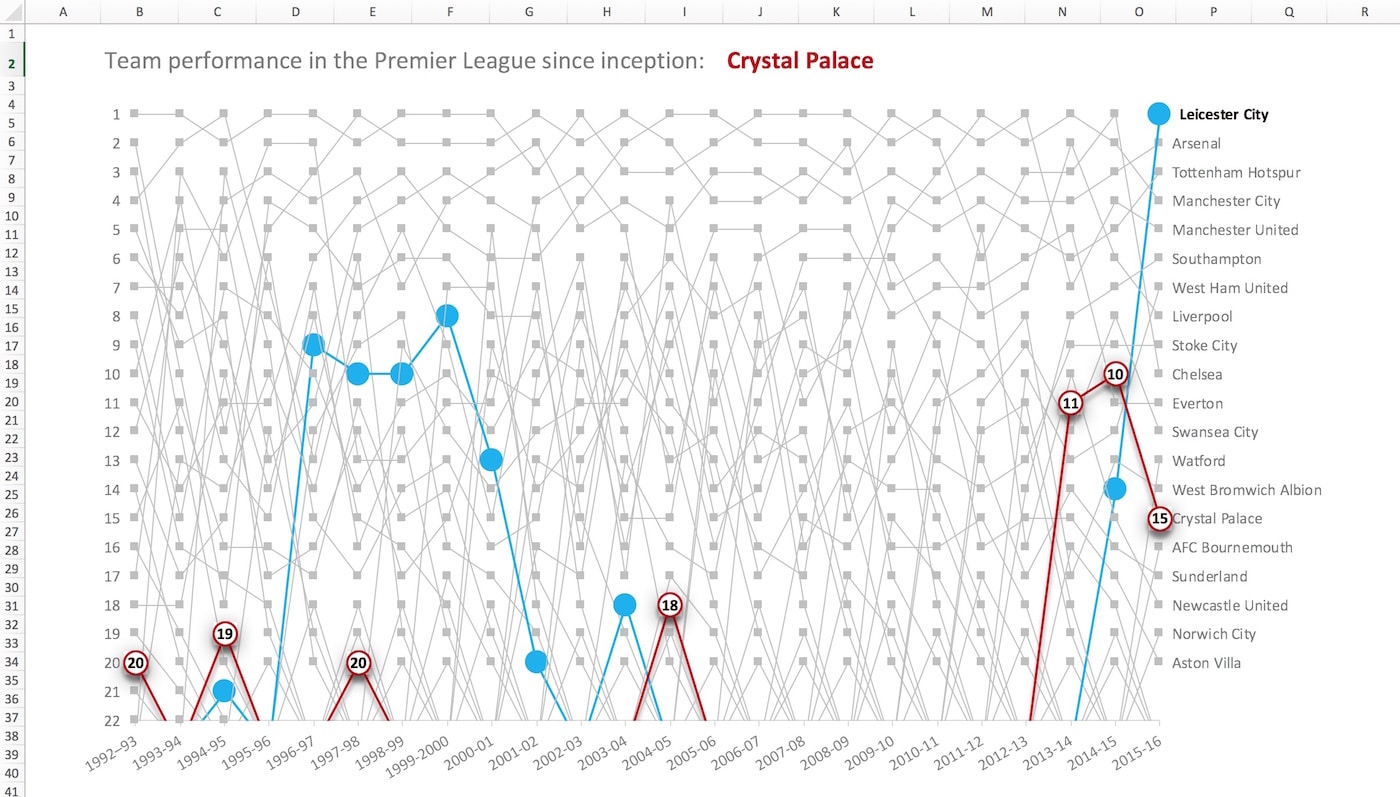
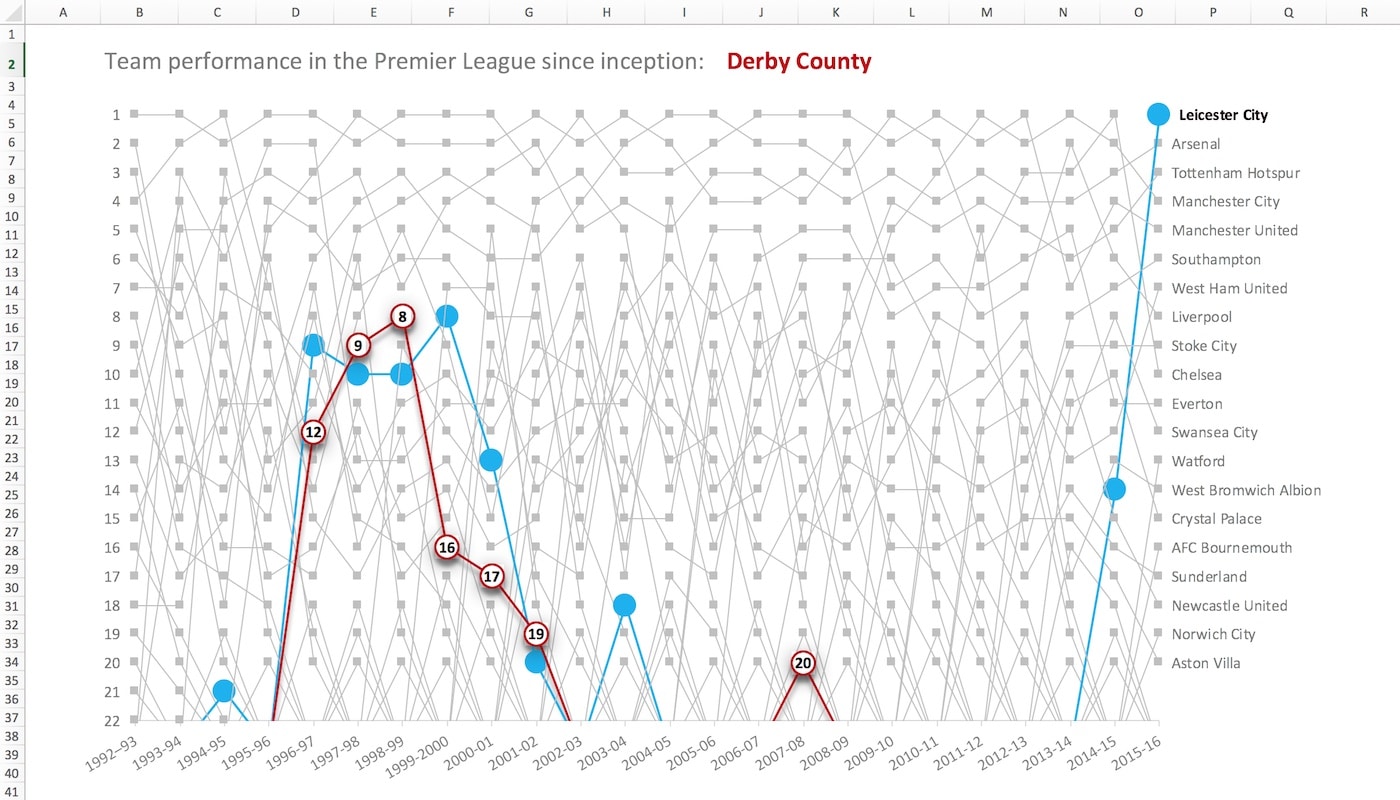
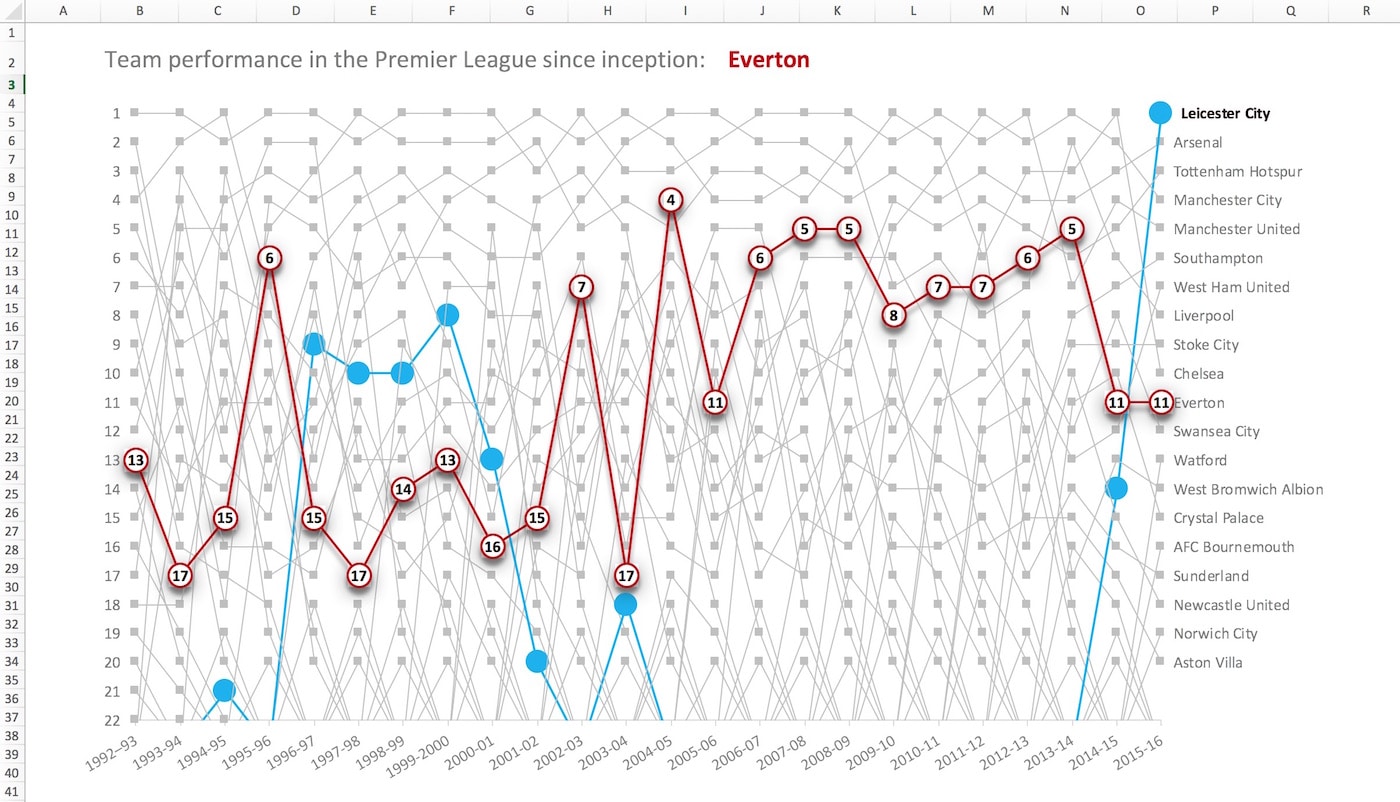
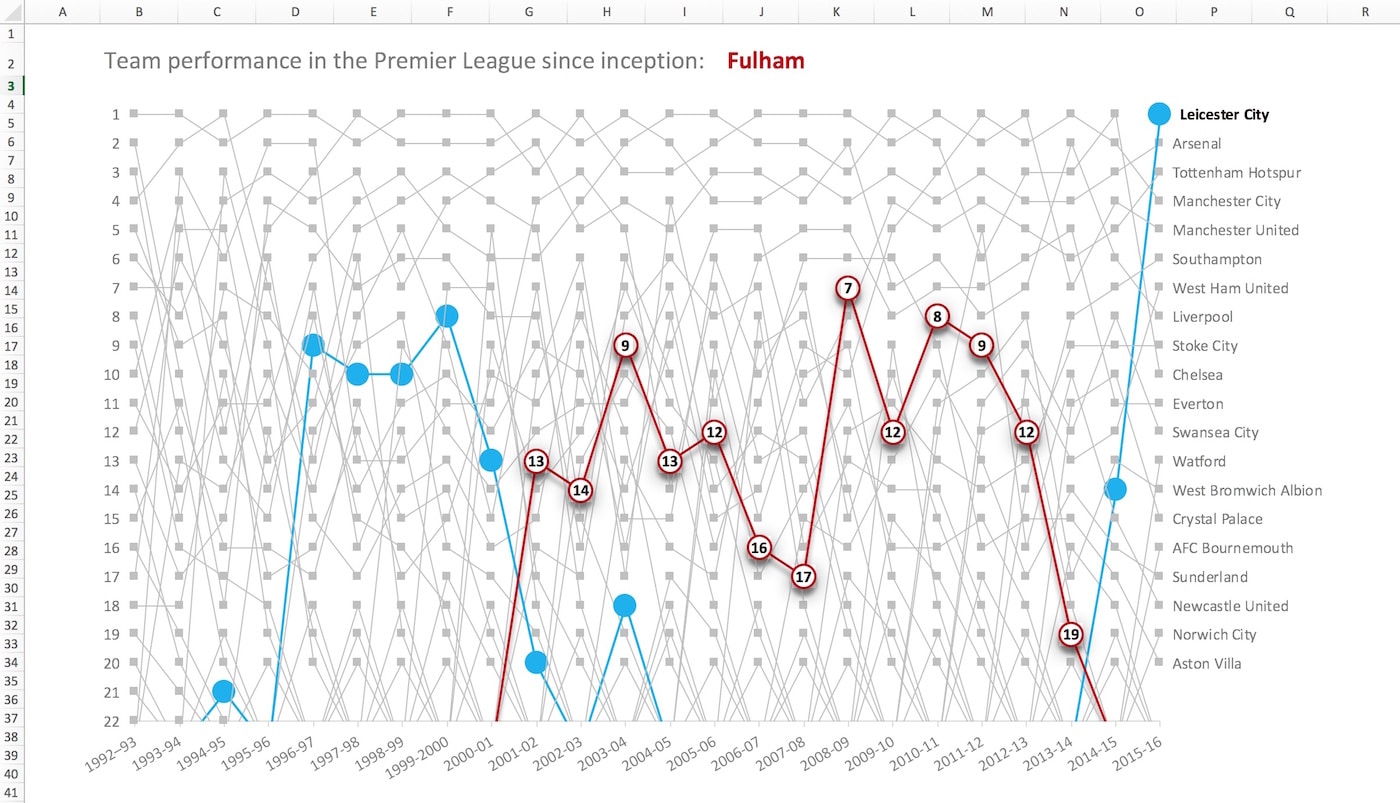
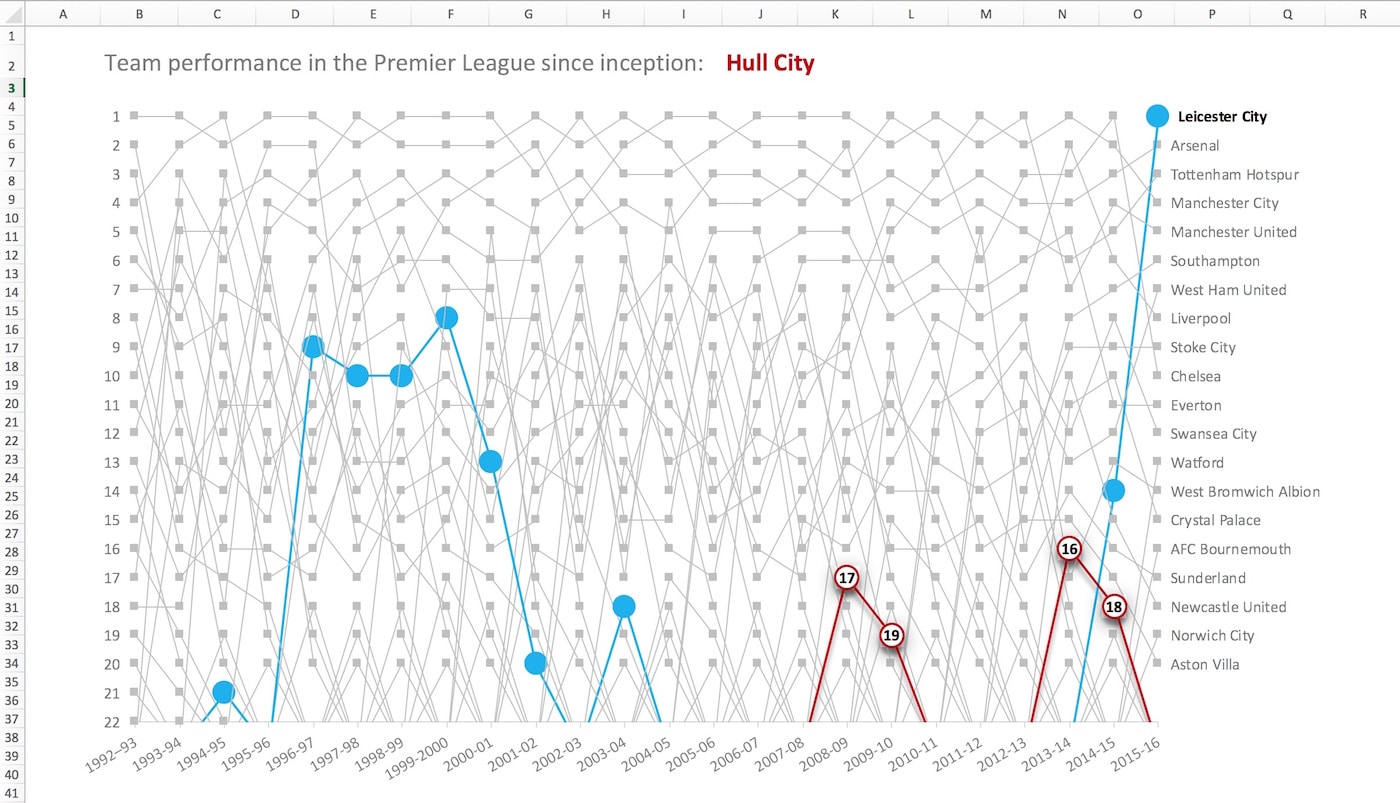
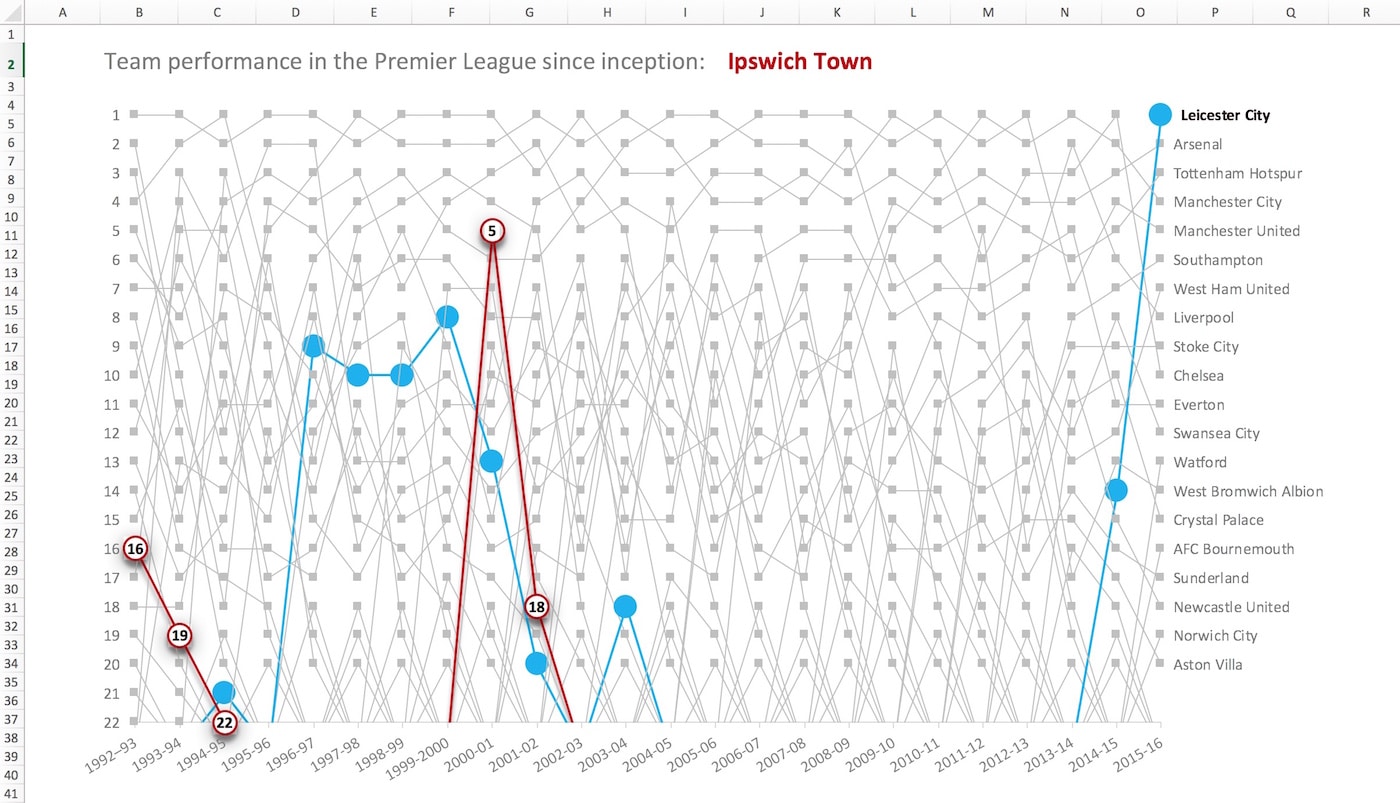
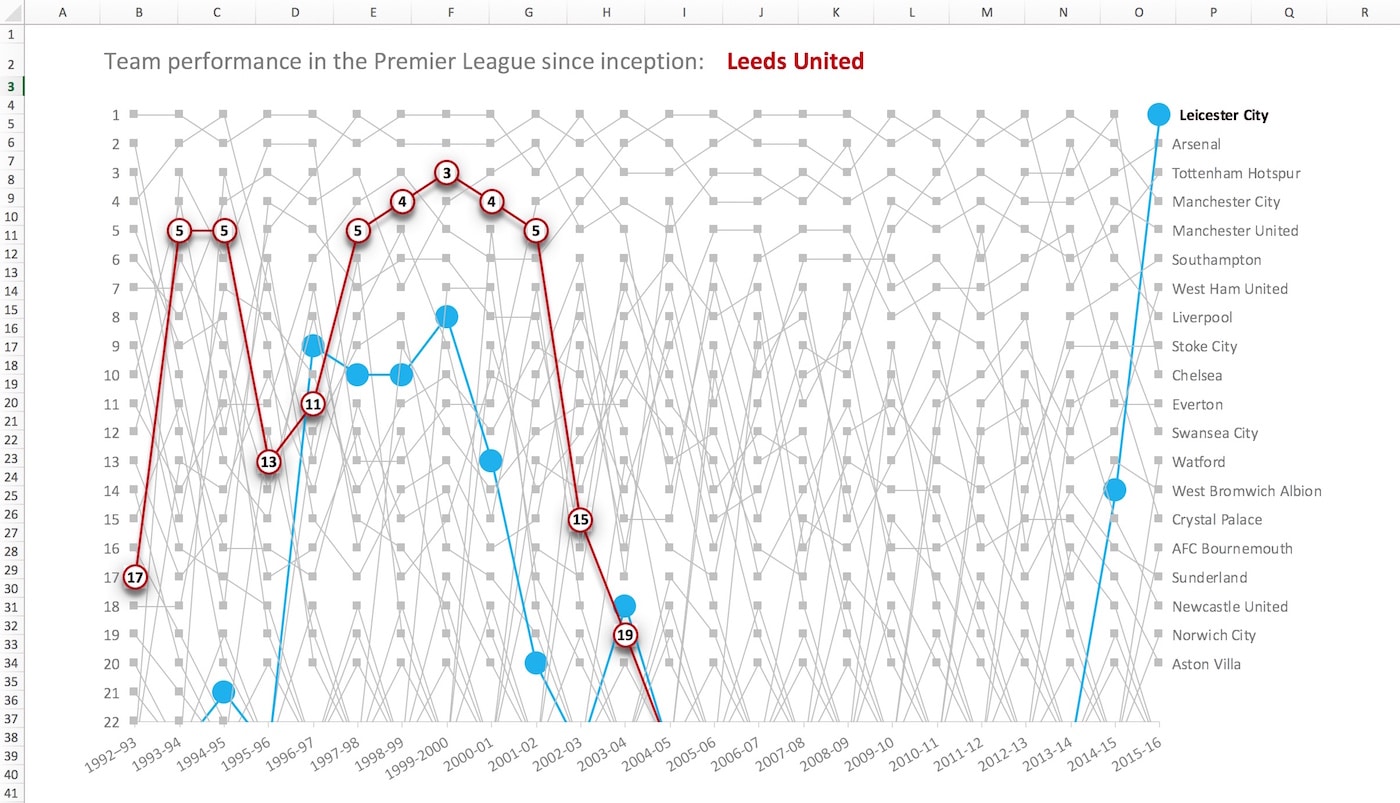
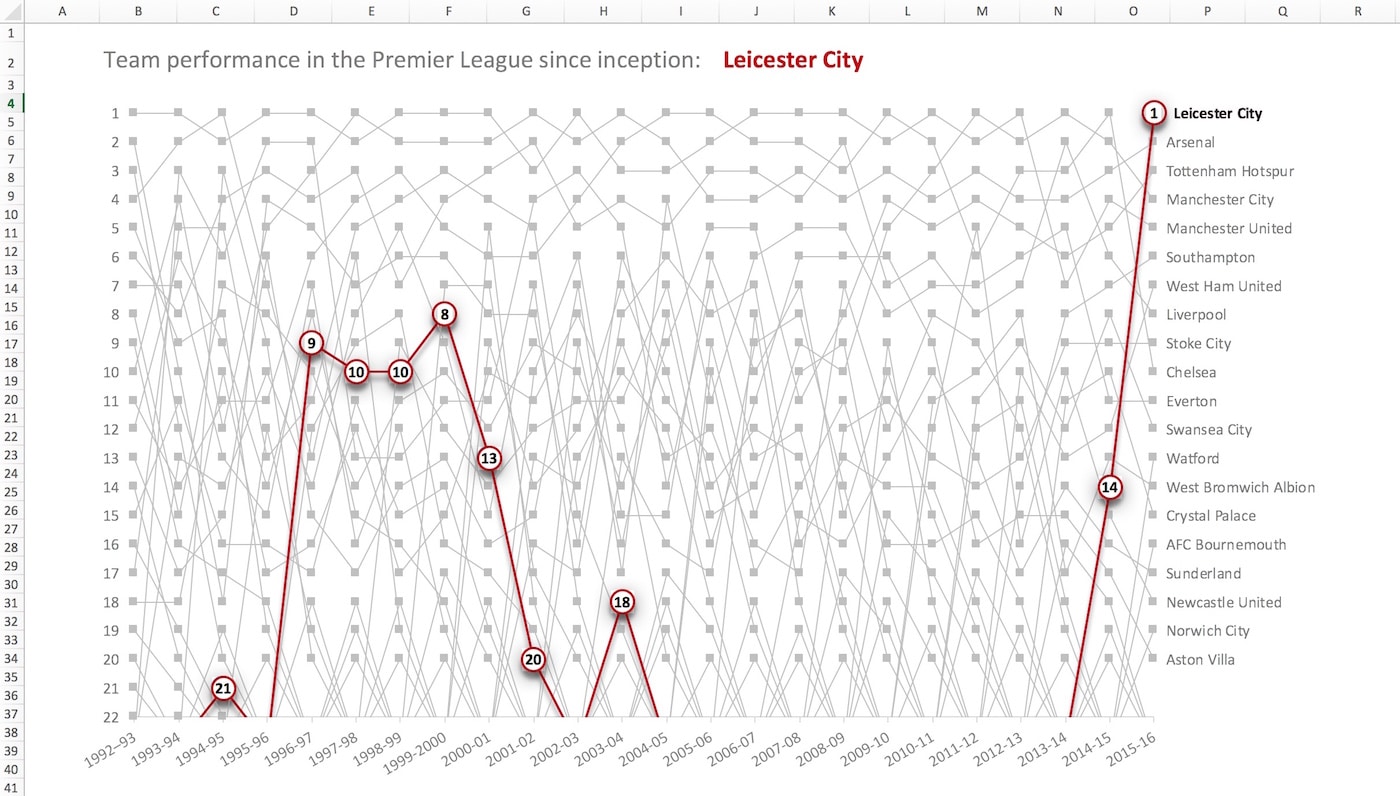
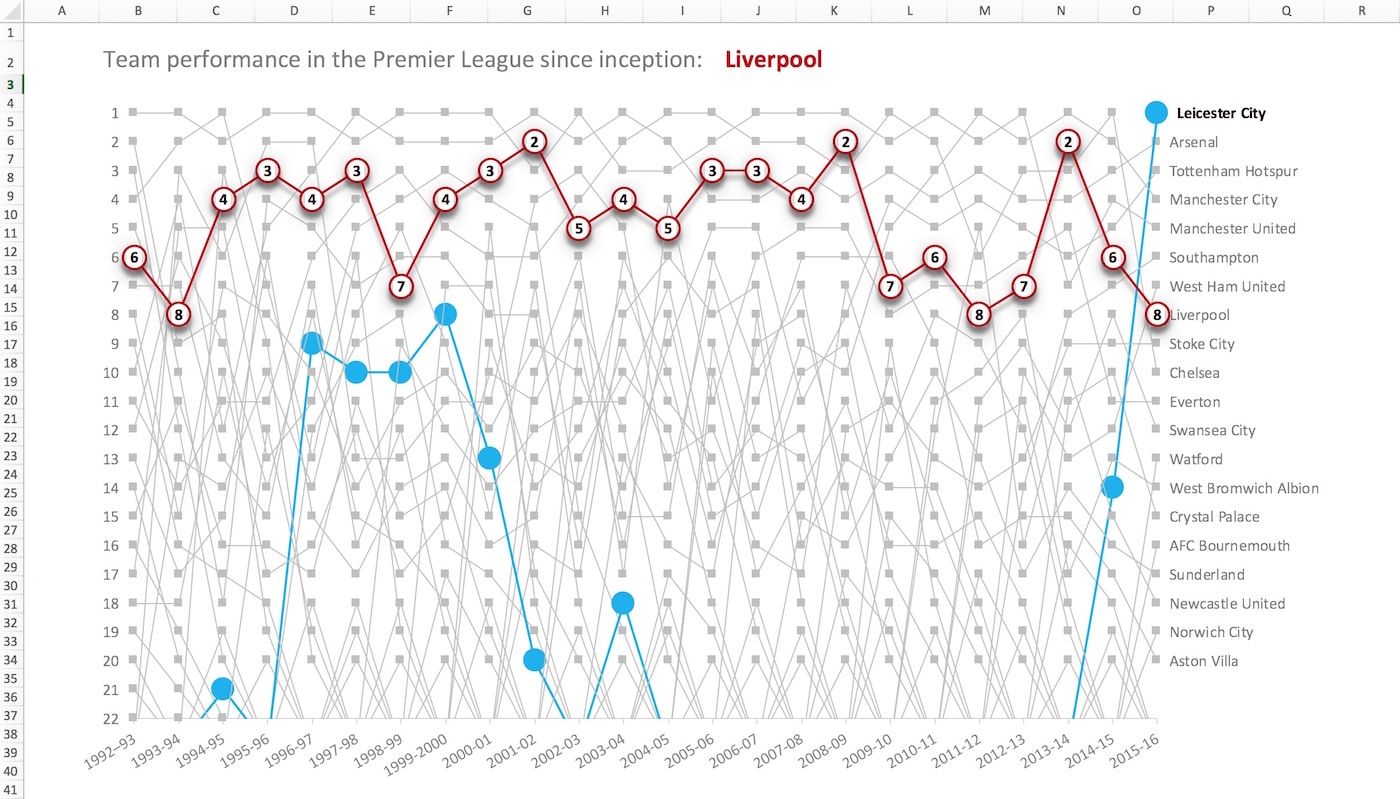
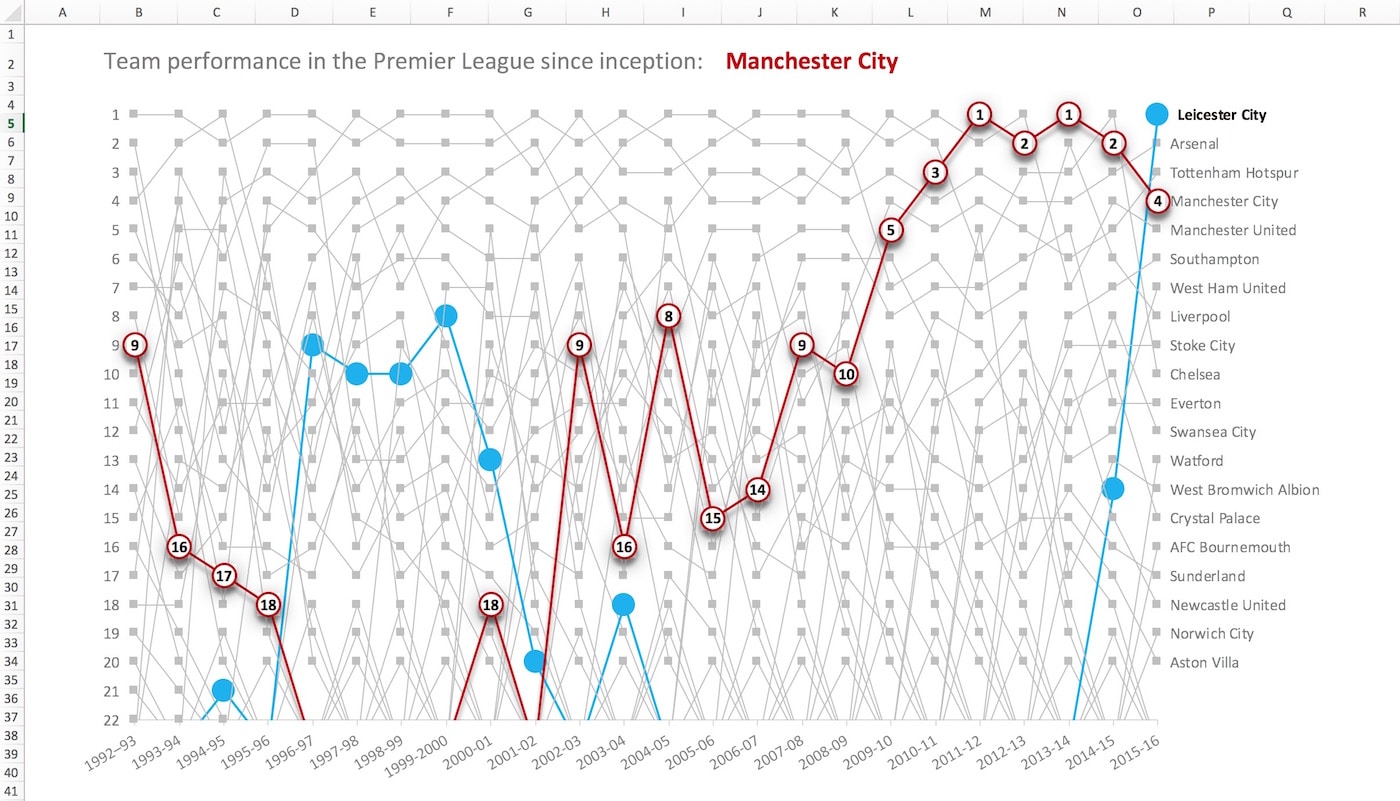
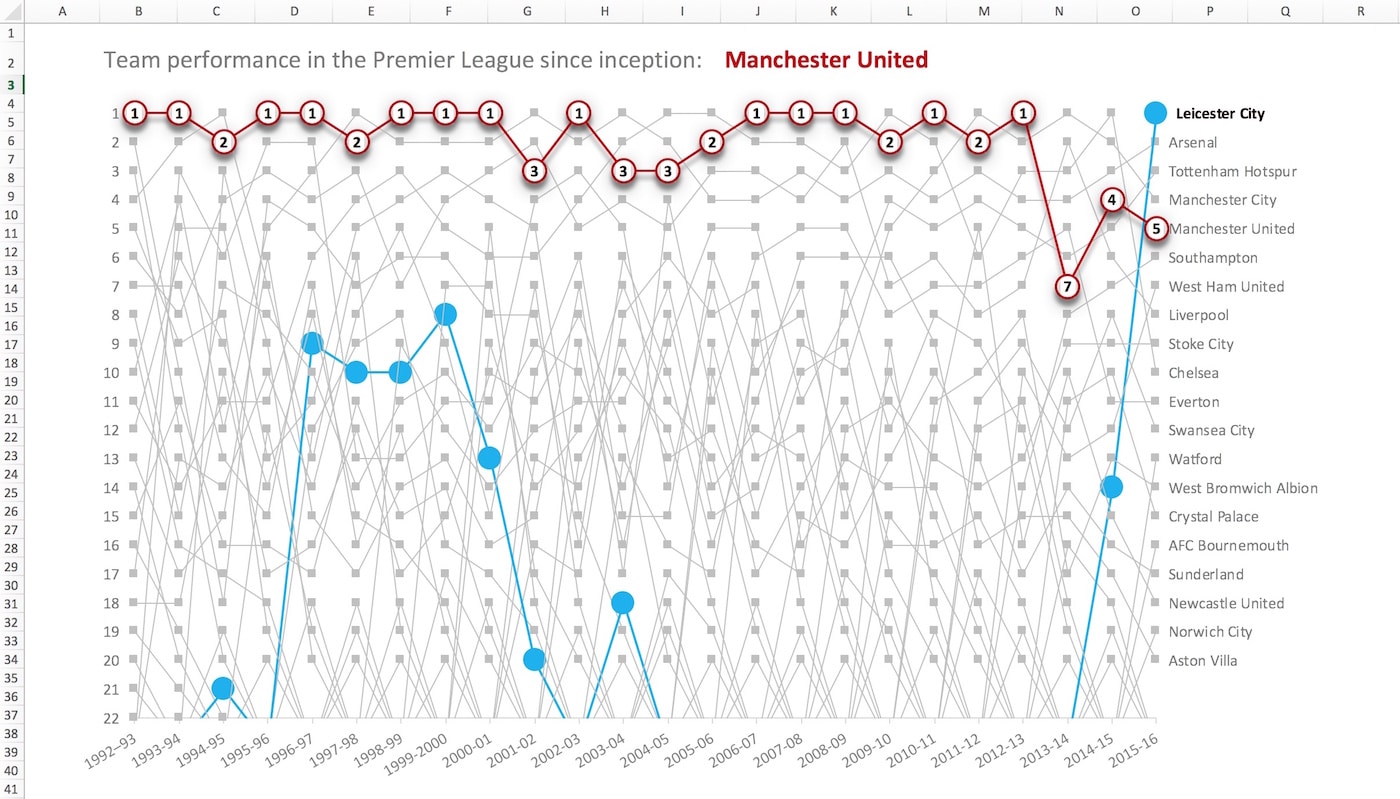
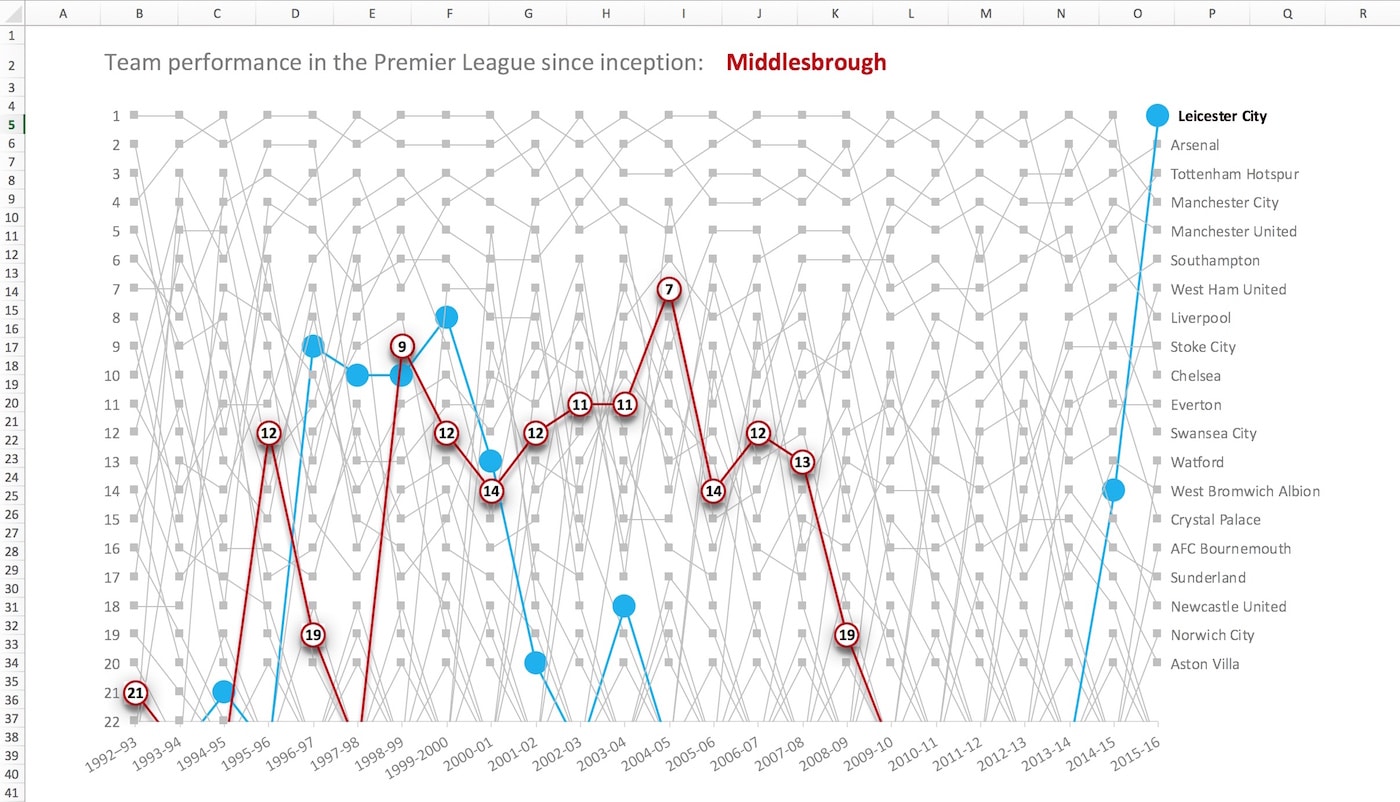
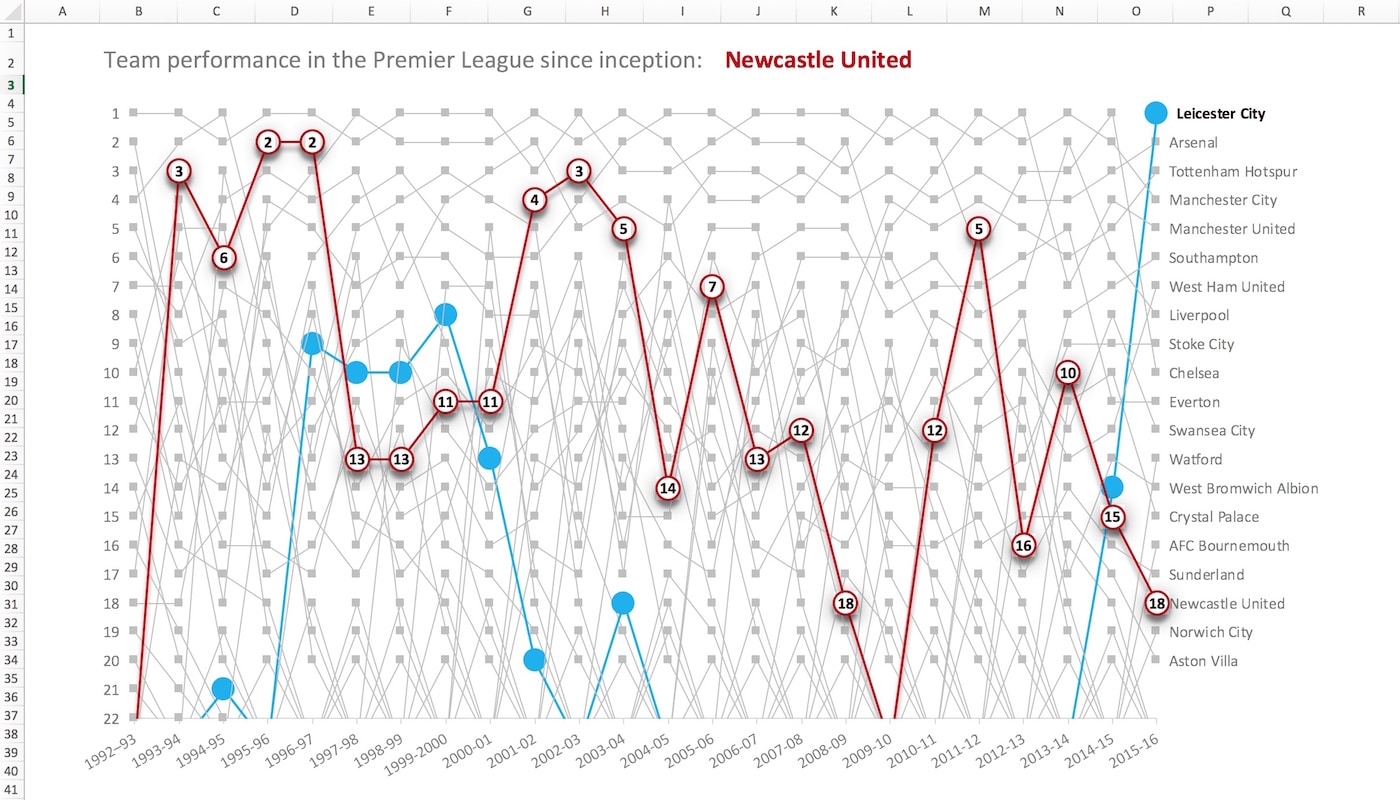
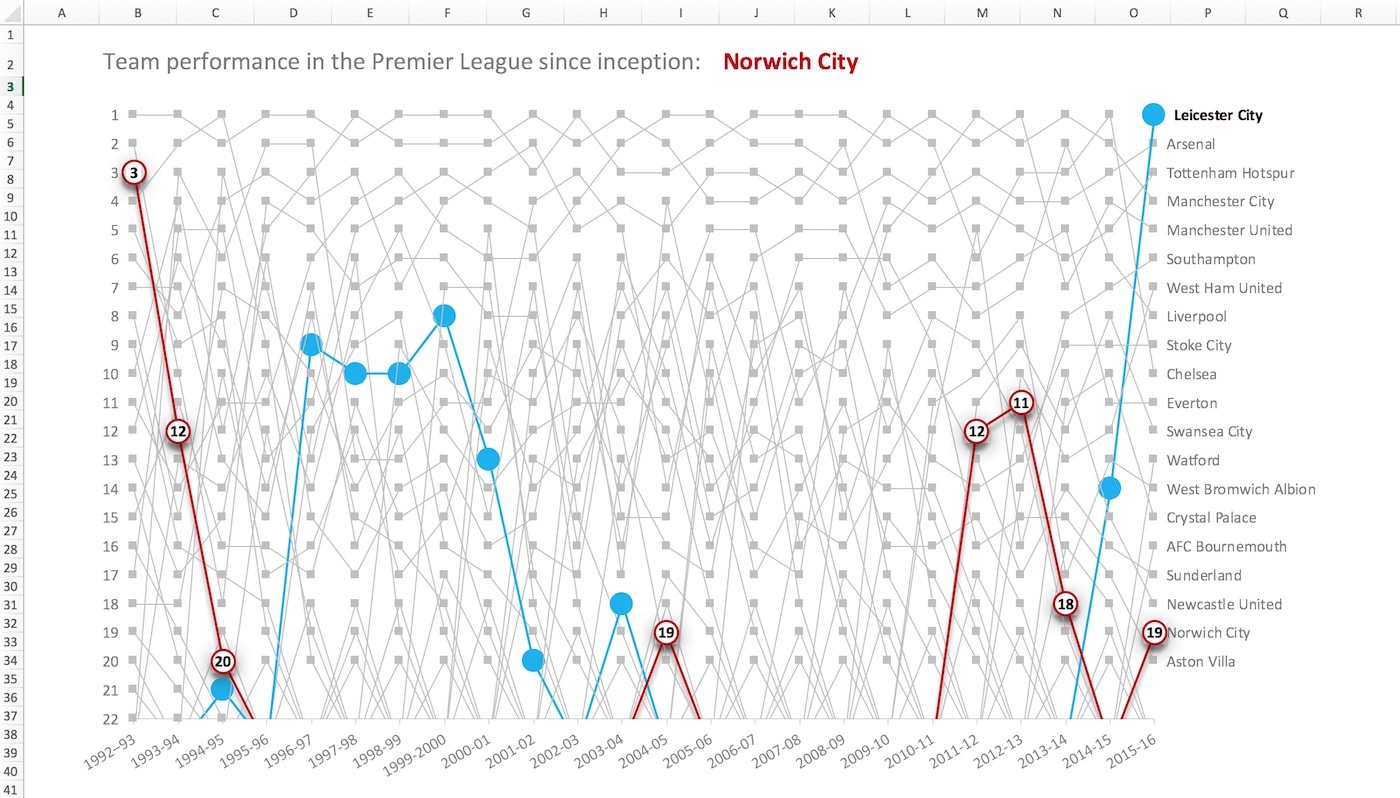
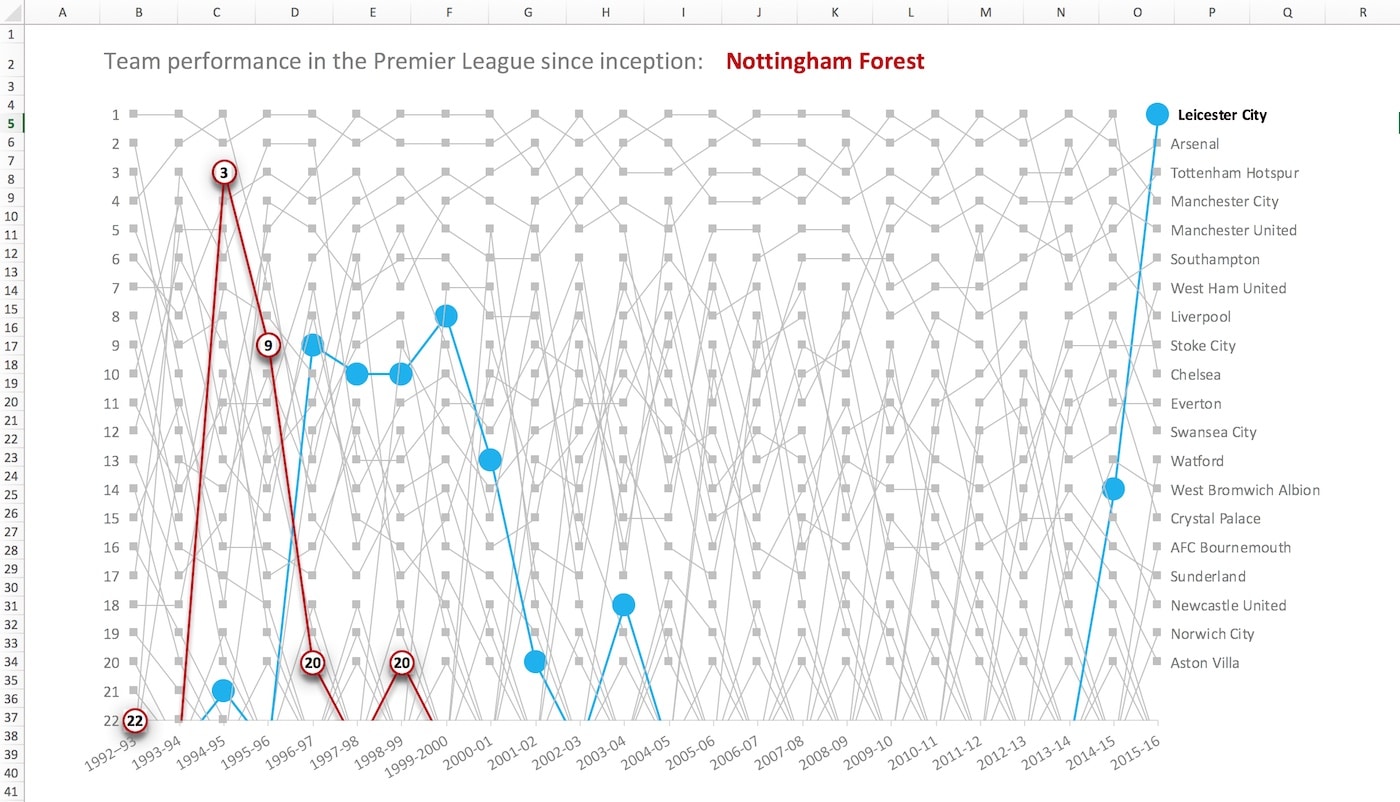
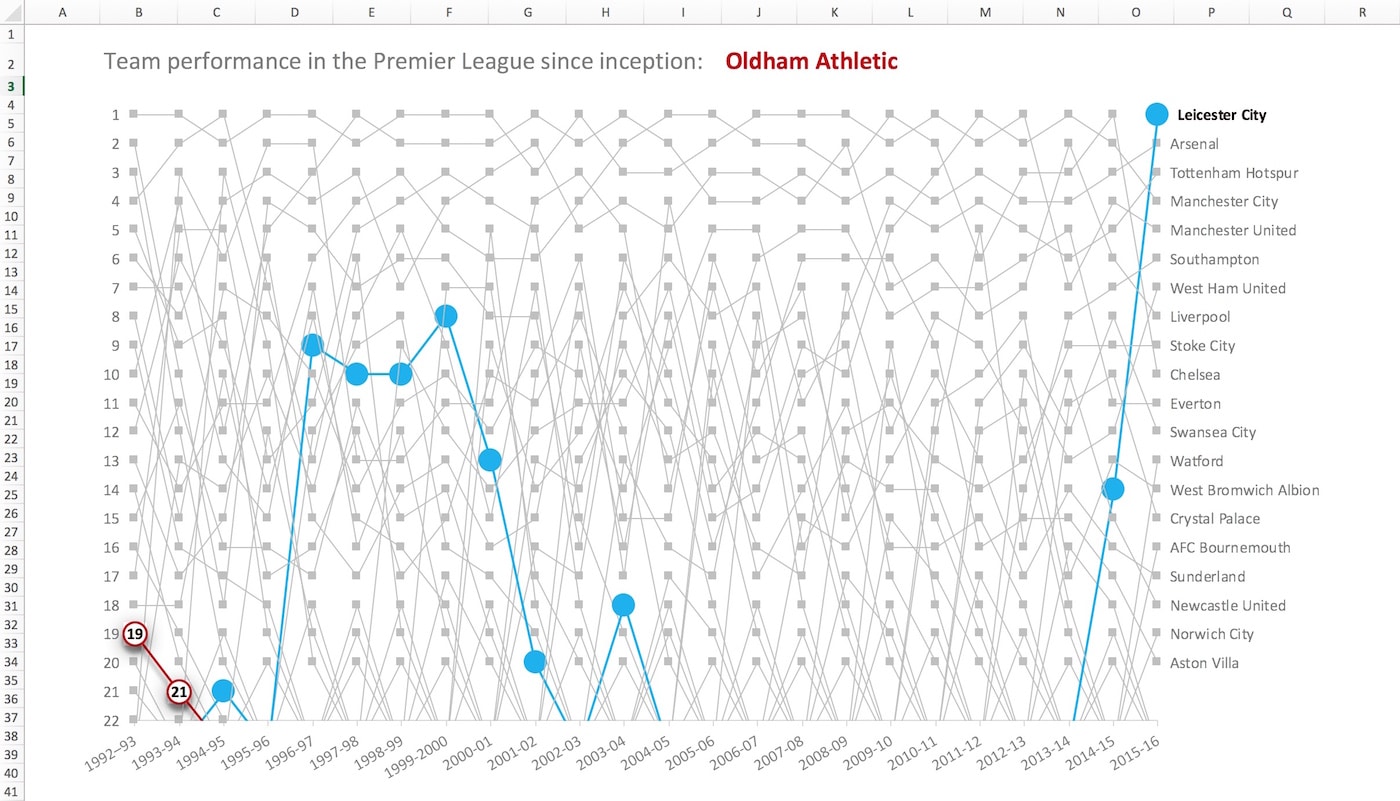
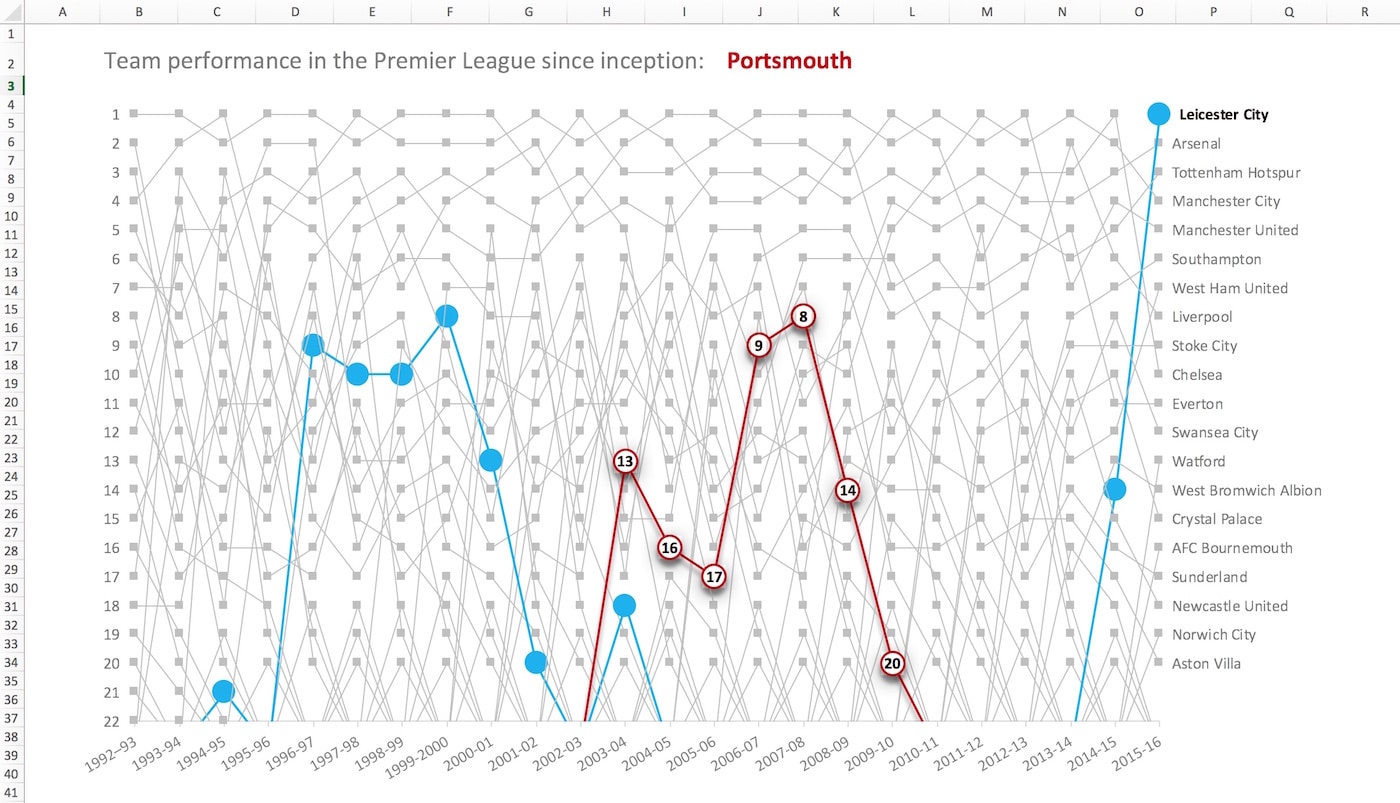
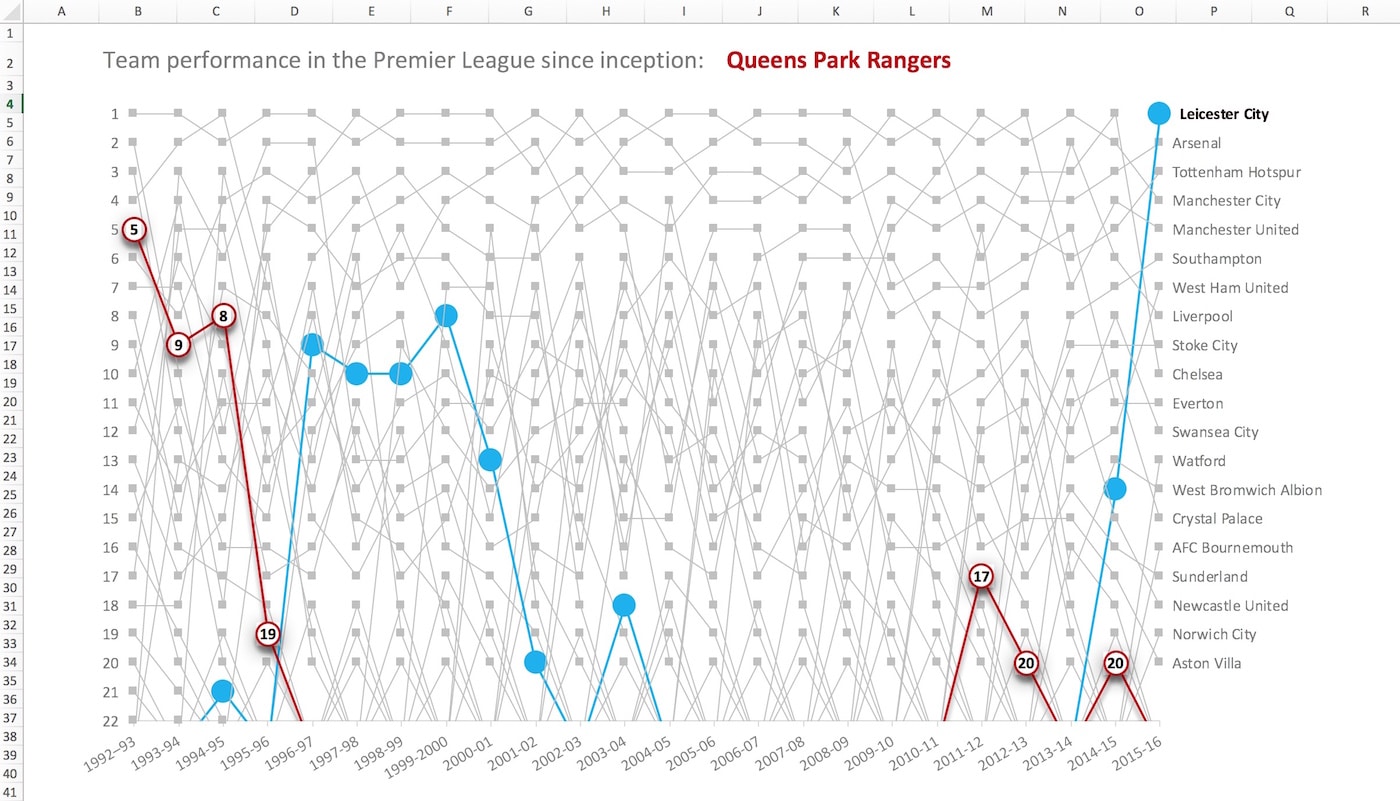
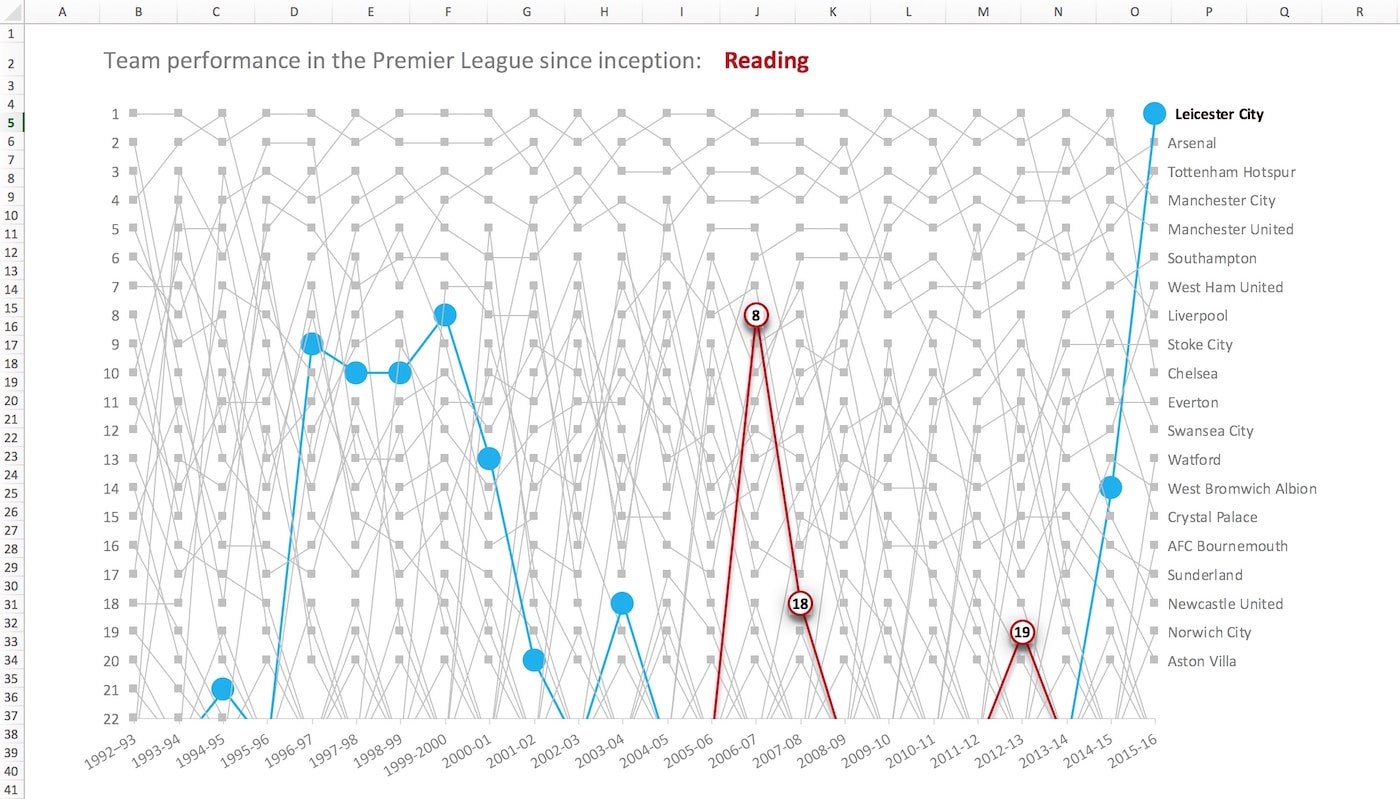
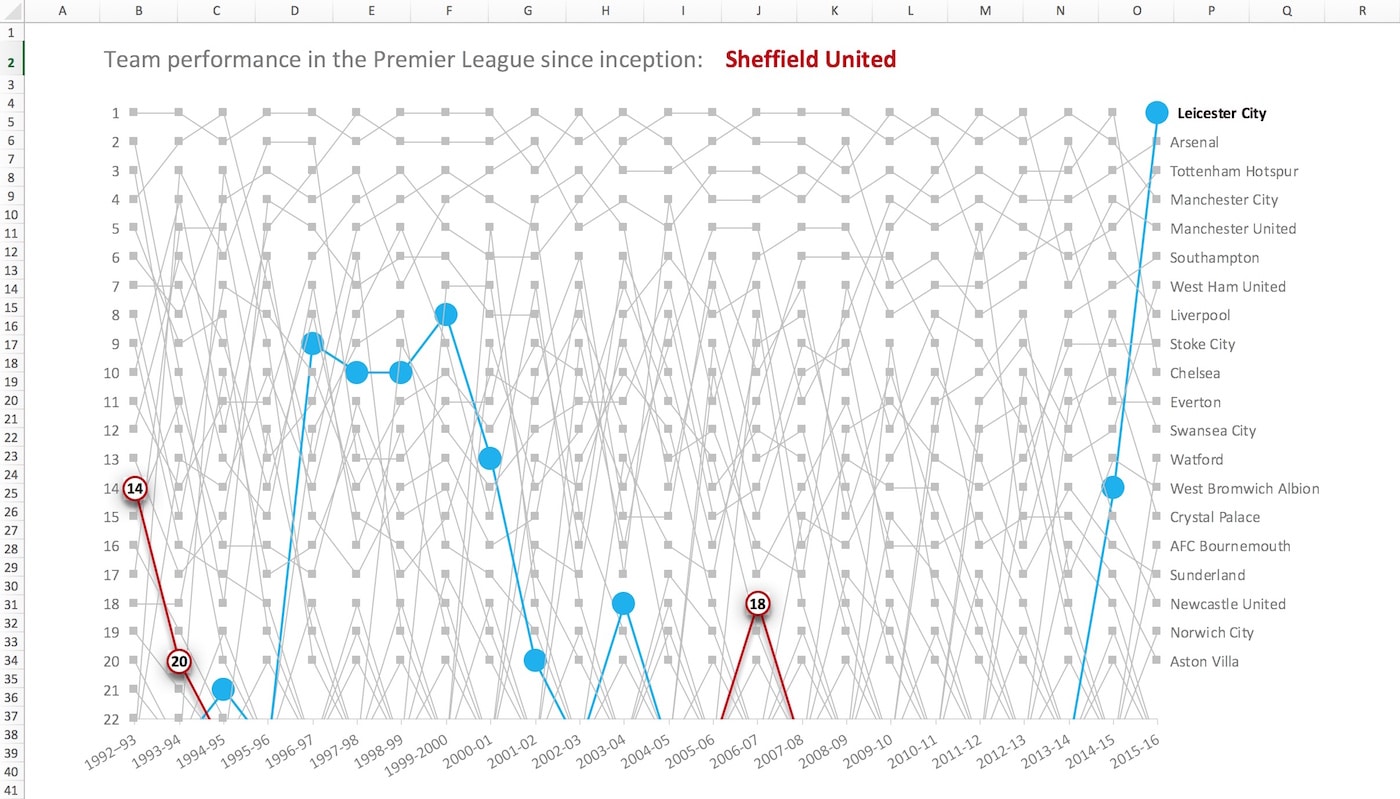
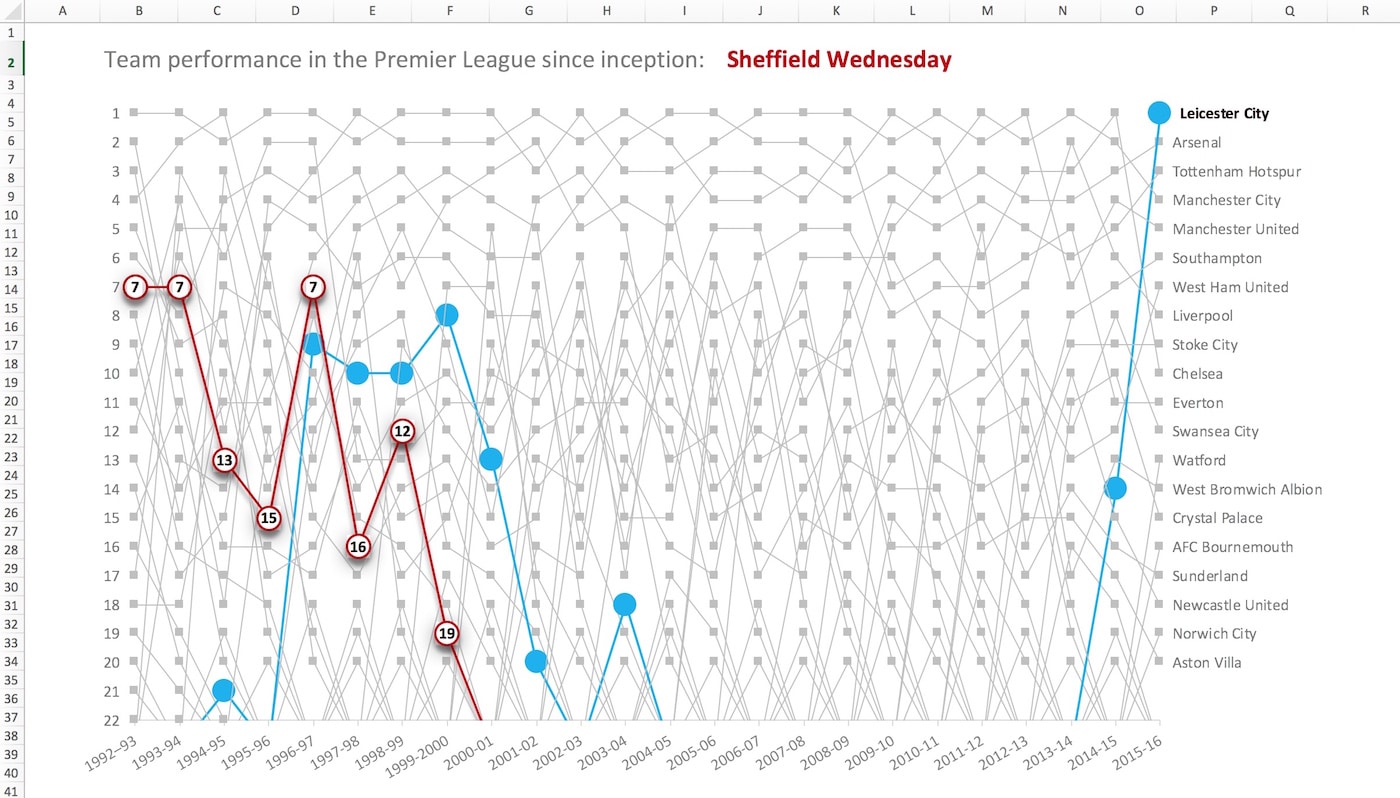
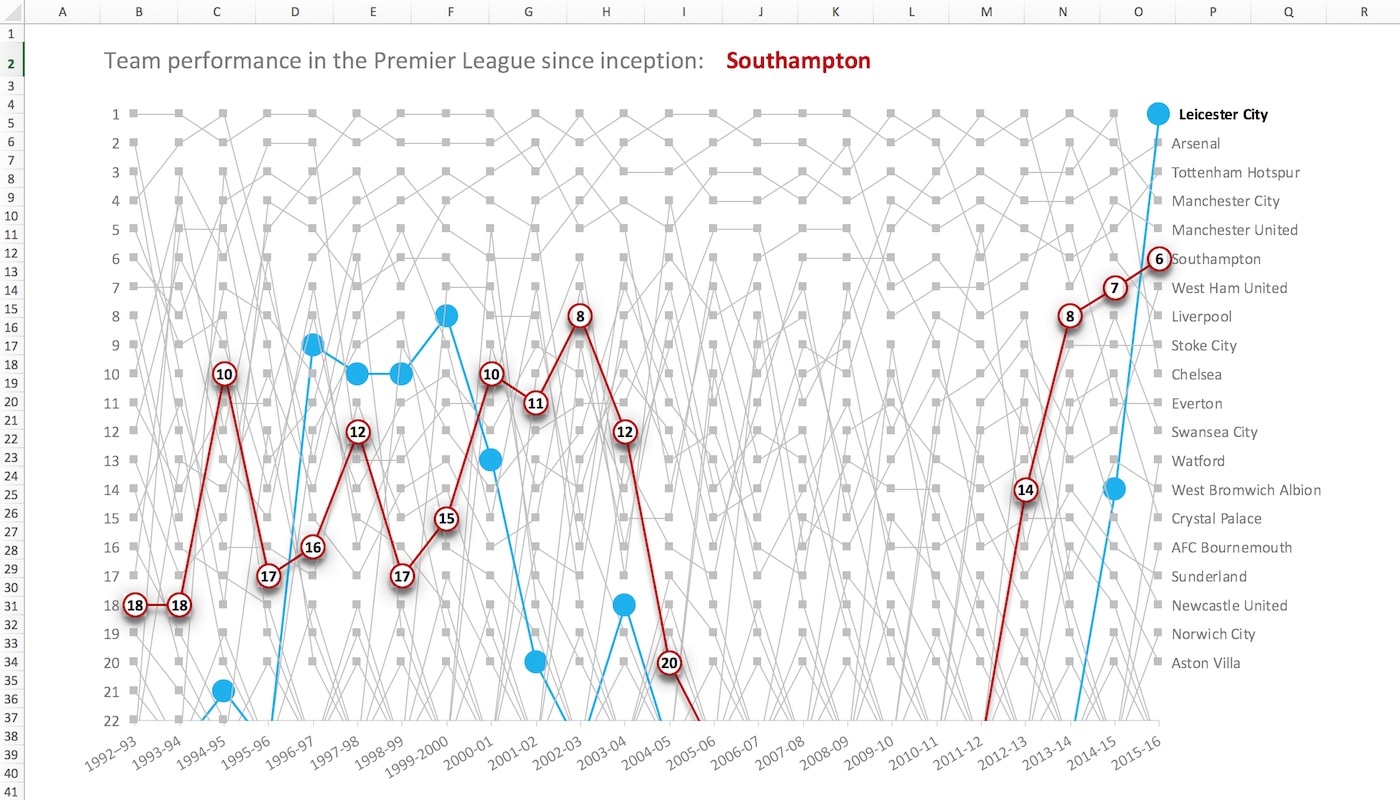
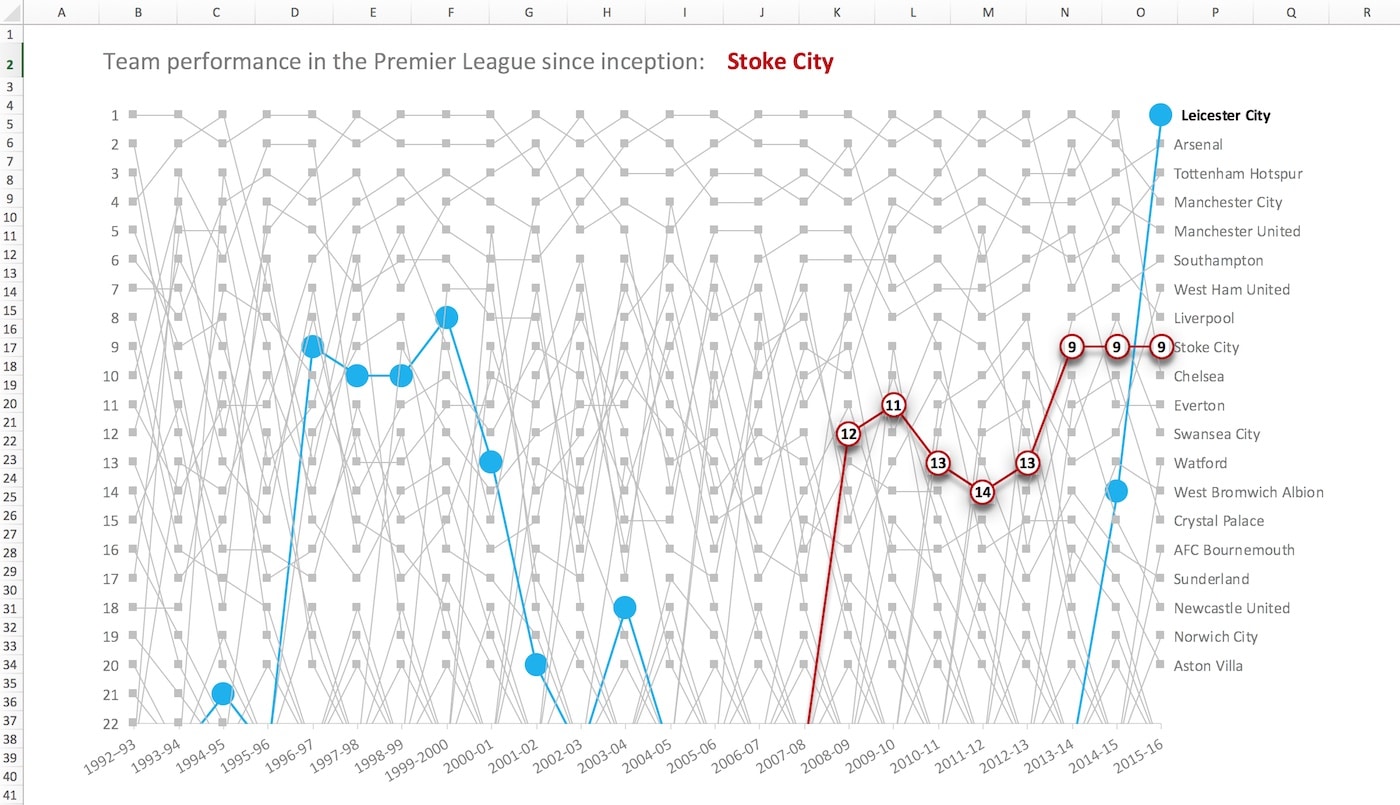
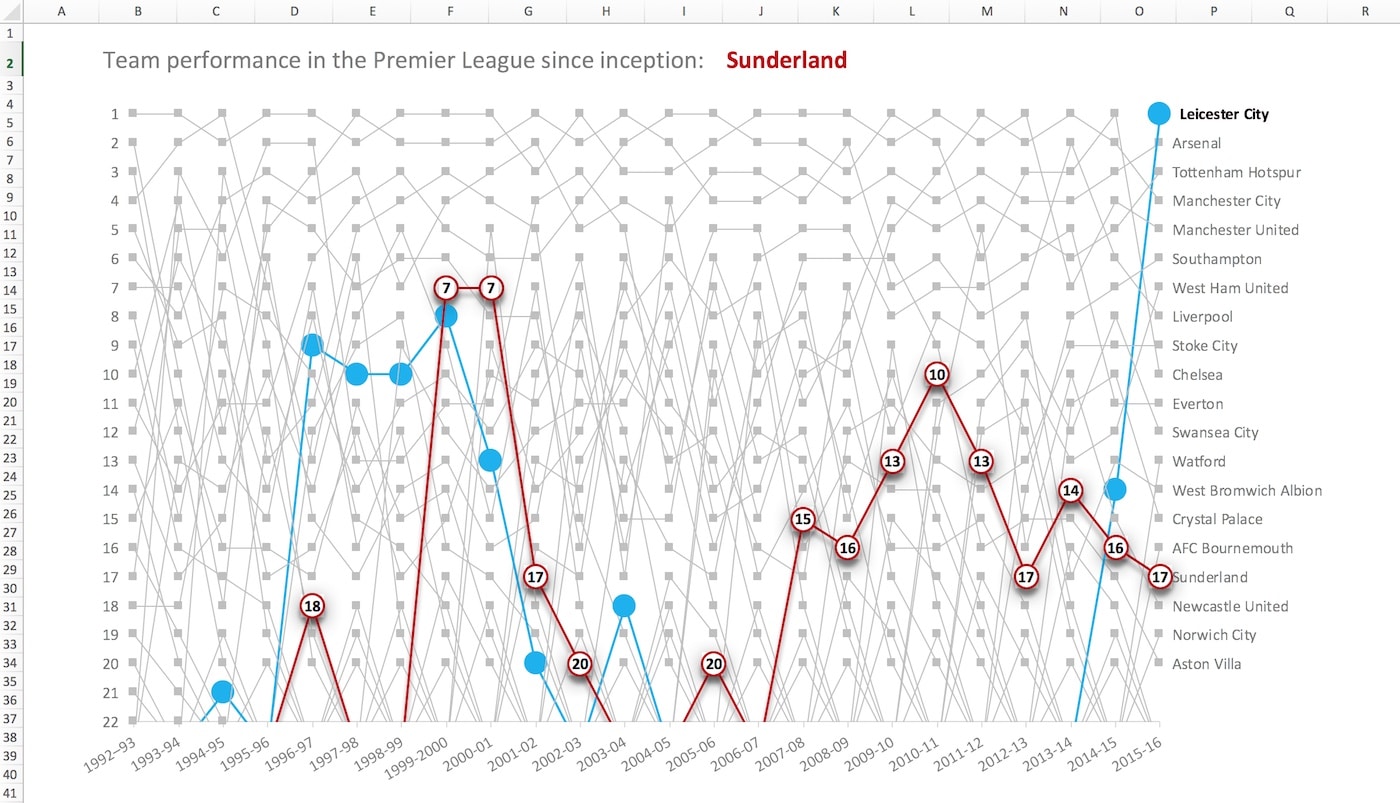
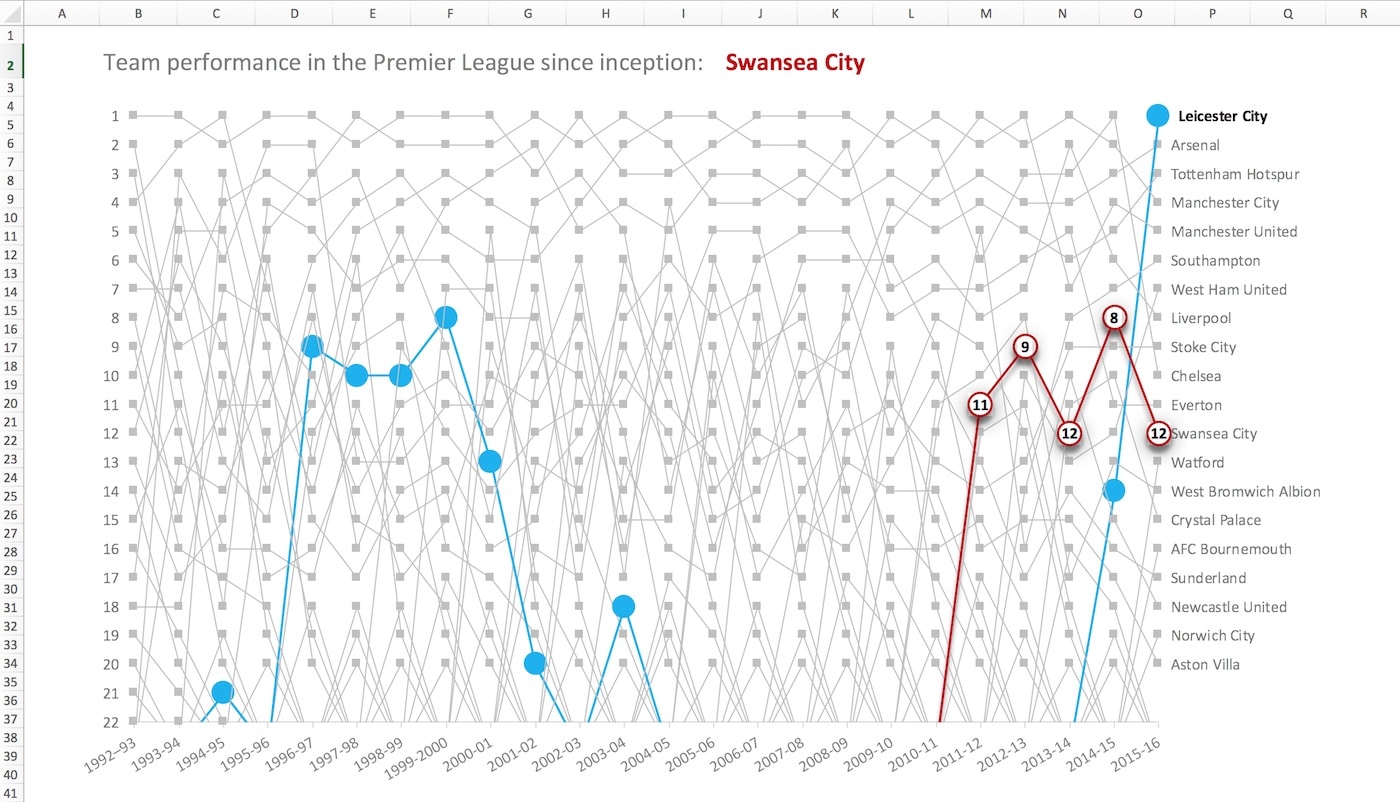
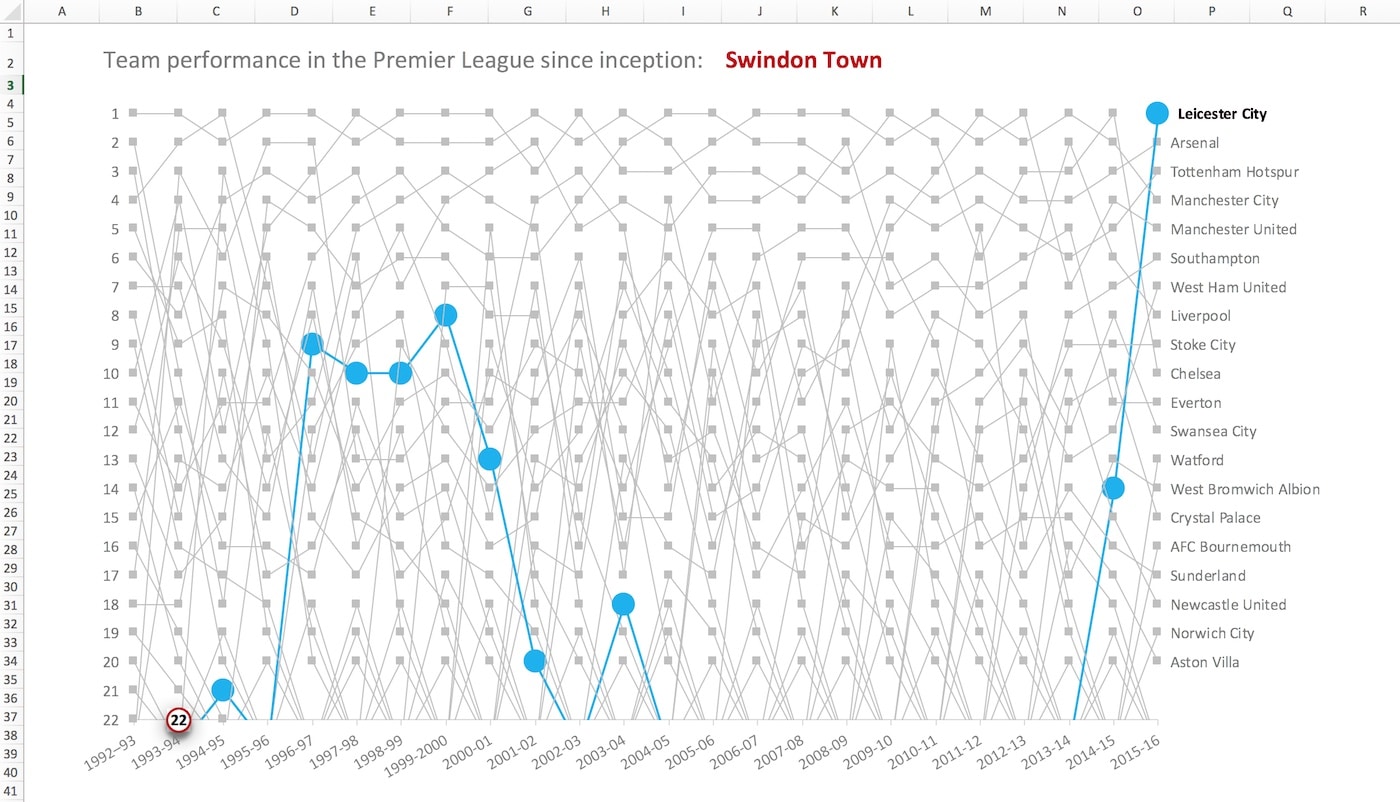
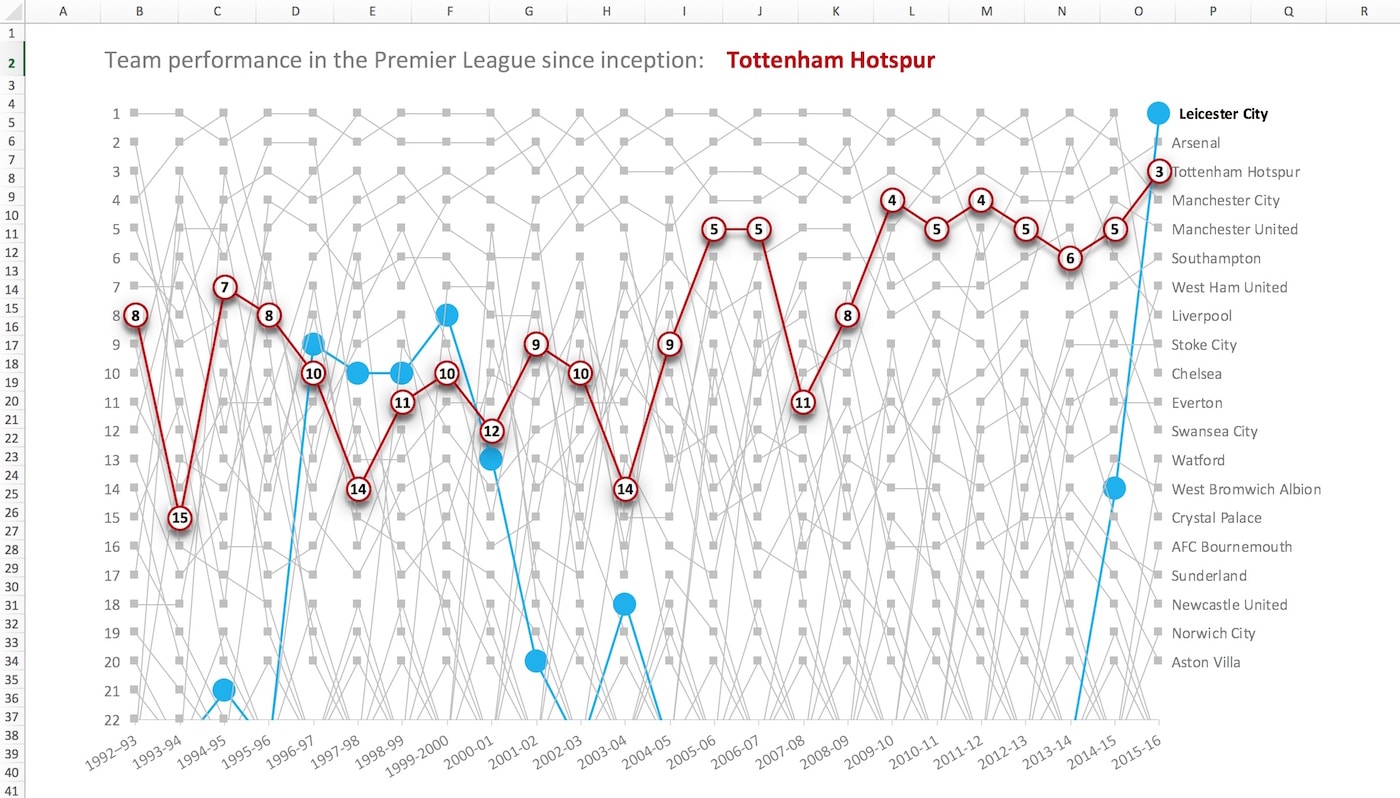
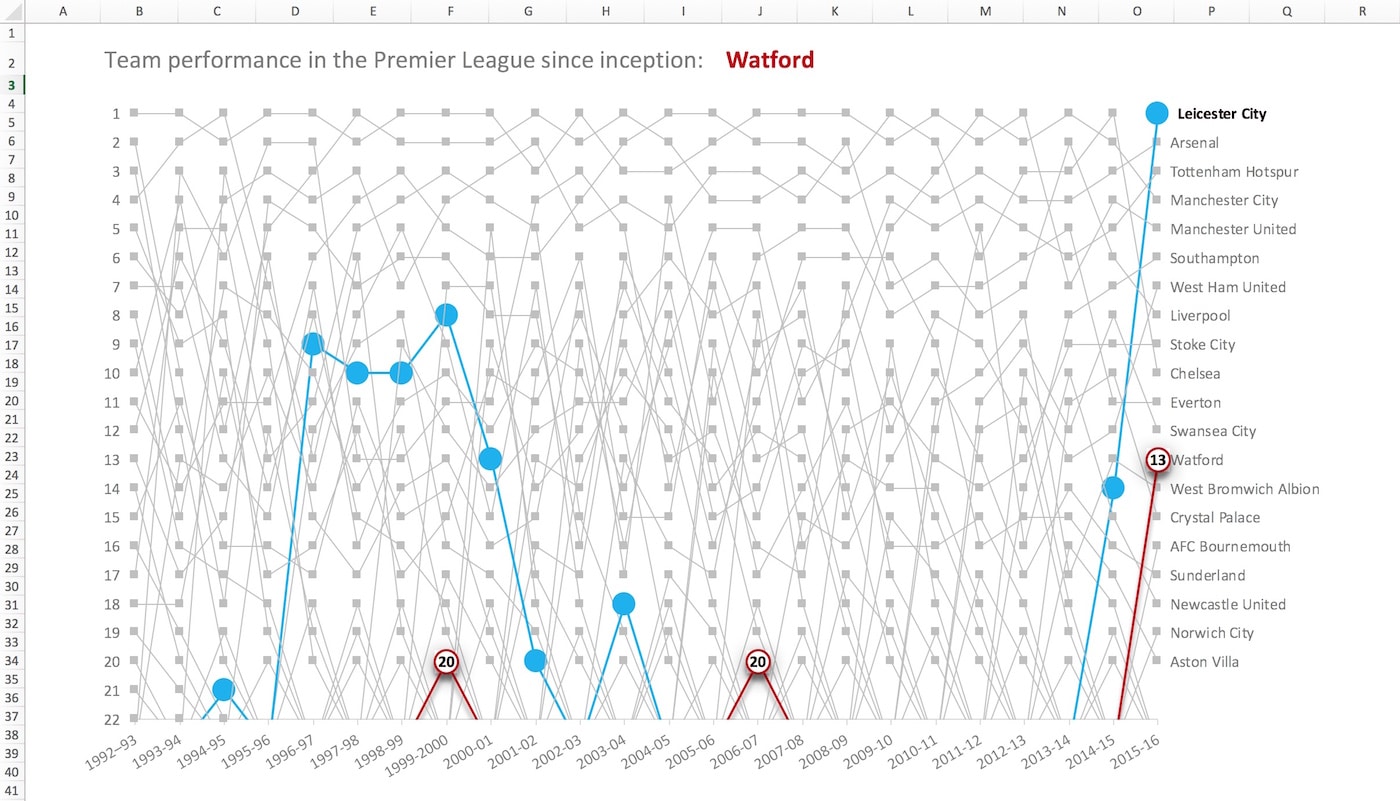
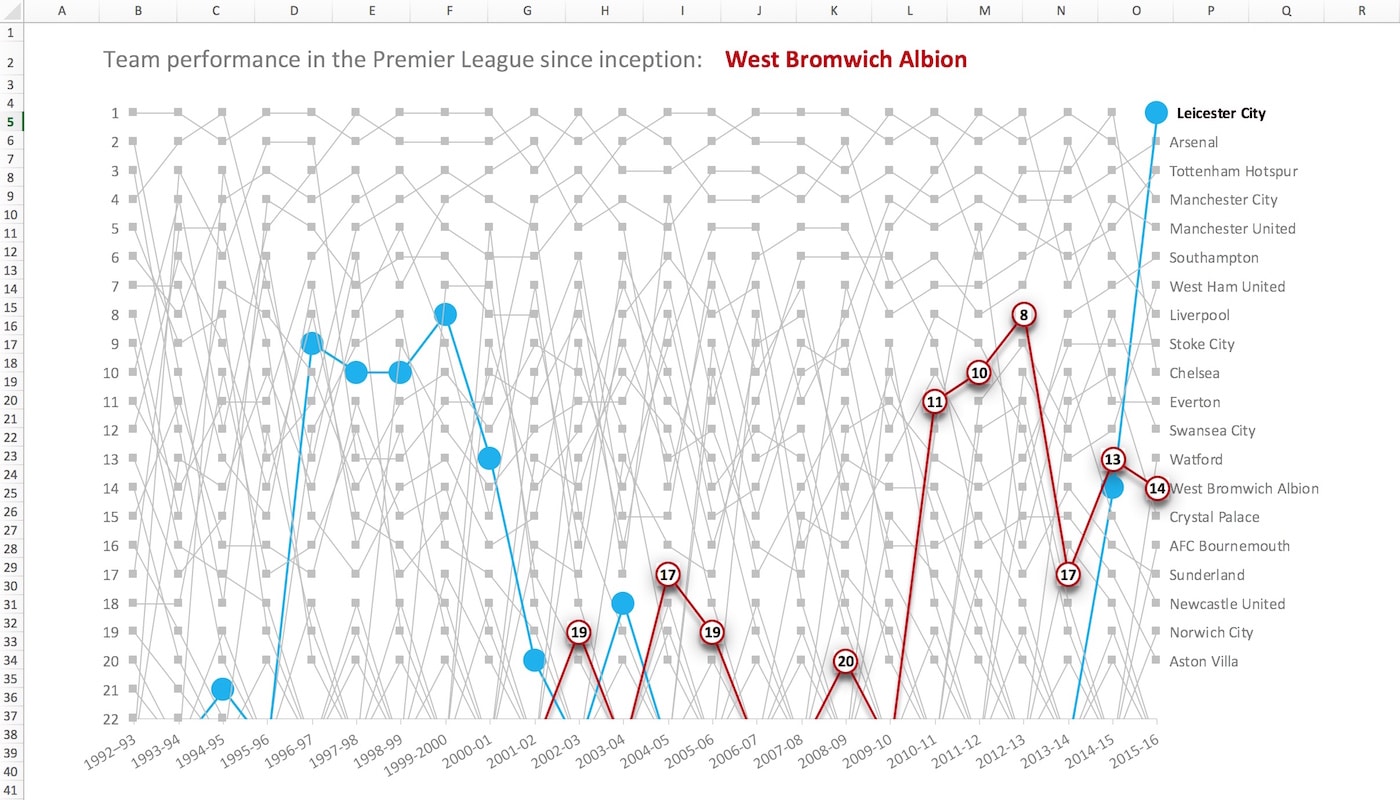
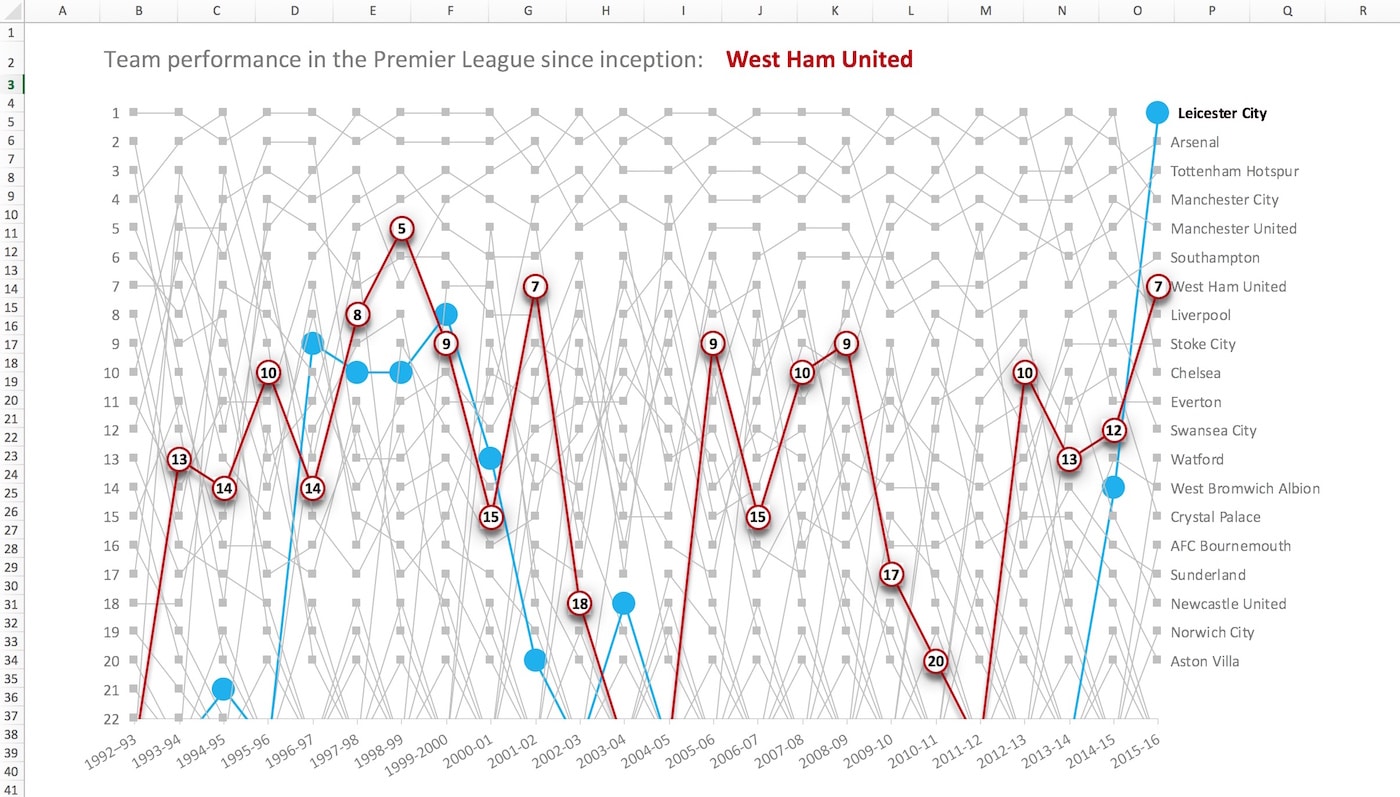
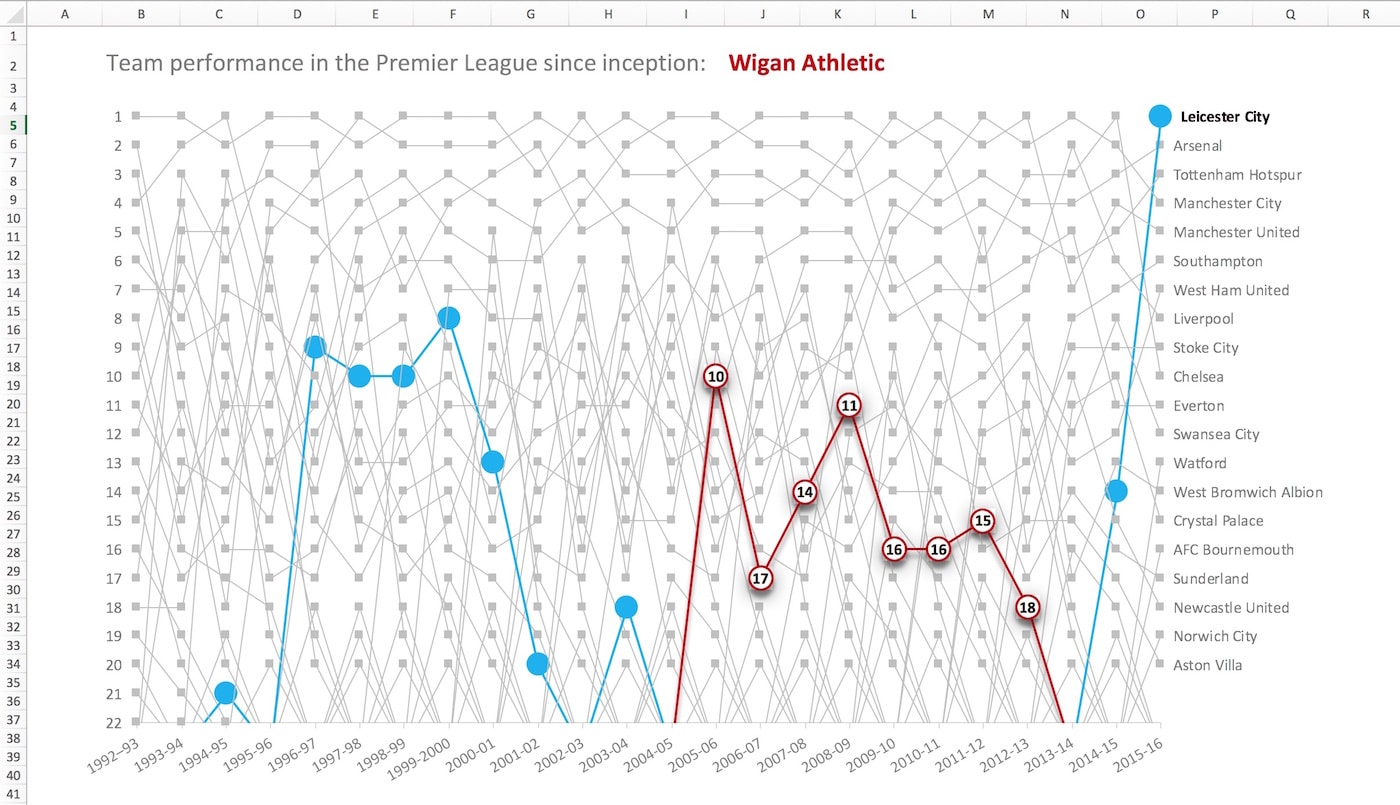
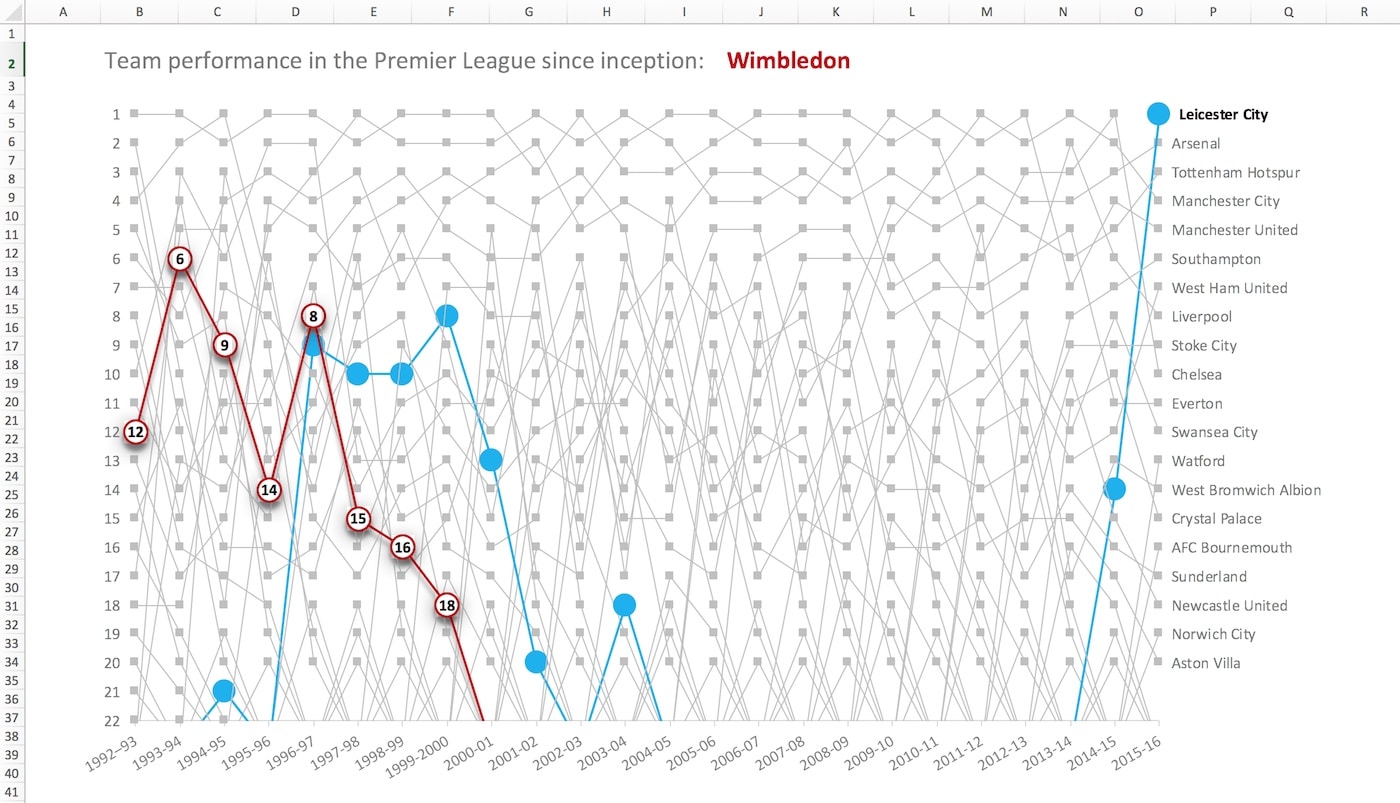
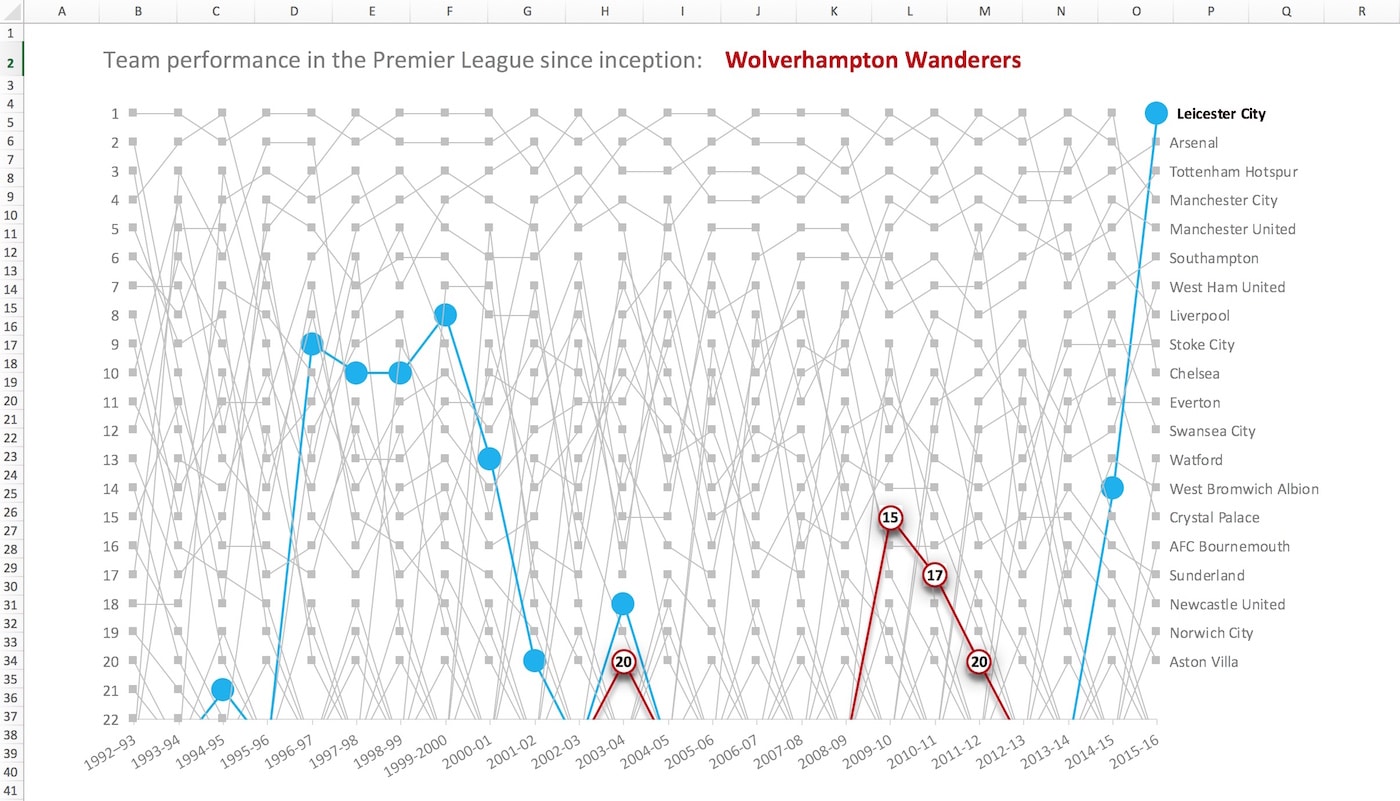
These charts show the performance of all the teams that have competed in the Premier League since its inception, the 1992-93 season (Leicester highlighted blue as the current 2015/16 champions):
AFC Bournemouth
Arsenal
Aston Villa
Barnsley
Birmingham City
Blackburn Rovers
Blackpool
Bolton Wanderers
Bradford City
Burnley
Cardiff City
Charlton Athletic
Chelsea
Coventry City
Crystal Palace
Derby County
Everton
Fulham
Hull City
Ipswich Town
Leeds United
Leicester City
Liverpool
Manchester City
Manchester United
Read about how I created this chart in Excel in this in-depth tutorial I wrote.
Middlesbrough
Newcastle United
Norwich City
Nottingham Forest
Oldham Athletic
Portsmouth
Queens Park Rangers
Reading
Sheffield United
Sheffield Wednesday
Southampton
Stoke City
Sunderland
Swansea City
Swindon Town
Tottenham Hotspur
Watford
West Bromwich Albion
West Ham United
Wigan Athletic
Wimbledon
Wolverhampton Wanderers
Bonus 48th chart – demonstration of the dynamic version in Excel:
Read about how I created this chart in Excel in this in-depth tutorial I wrote.
Can’t open this page, shame I have big interest in premier league
where is the spreadsheet
Here’s the tutorial explaining how to: https://www.benlcollins.com/spreadsheets/excel-bump-chart/
(this project was from 2016 keep in mind)