26 July 2018: I’ve been at the Google Next cloud conference this week, in San Francisco. They announced a ton of exciting new features and products for both G Suite and the Google Cloud Platform.

The Google Sheets product team announced a bunch of exciting new features coming soon to Google Sheets.
Here’s a brief recap:
5 million cells! (Sneak peek)
Nice! A big jump in the size of data we can work with in Sheets. This will open up Sheets for bigger data projects now.
Update December 2018: This feature has been released! Check the File sizes help page.
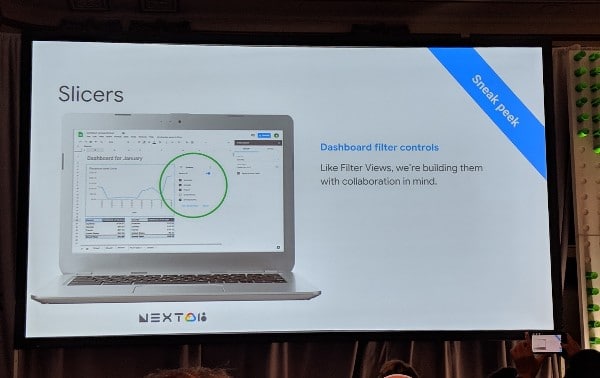
Slicers (sneak peek)
This is a great addition for those of us who build reports and dashboards. Slicers are like checkbox buttons we can add to pivot tables and charts to make them much more interactive from a user stand point.
You’ll be able to add a slicer for a given field so that a user can then filter to just see the data they want.
It’ll be much more functional and elegant than the data validation drop-down method or checkbox methods you can use at the moment.
Charting upgrades (sneak peek)
It’s great to see charts getting some love! It’s one area where Google Sheet has fairly limited functionality, but we’ll soon have much more granular control over how our charts look.
For example, the updates will include the option to color datapoints individually (as shown in this image):
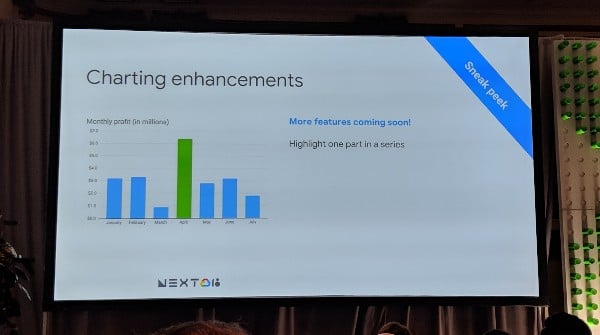
Update January 2019: This feature has been released! Check this article on how to add custom formatting to individual data point.
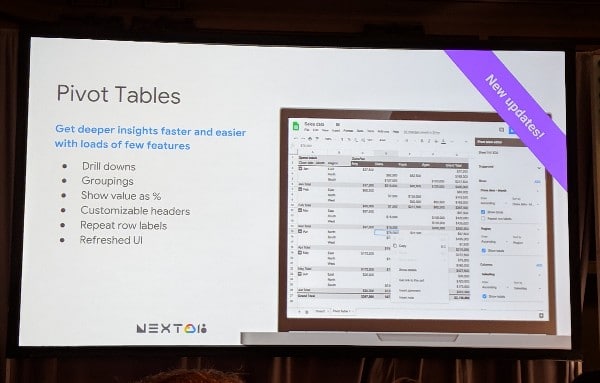
Pivot Table upgrades (recently launched)
Pivot tables recently got a facelift, with a new, more user-friendly UX.
Even more useful though, pivot tables now have the option to group data (for example to group dates into months, or quarters etc.) and drill-down on data (so you can select an aggregated record and see all the data behind it with a single click).
These are really, really strong updates to Pivot Tables and dramatically increase the power of pivot tables.
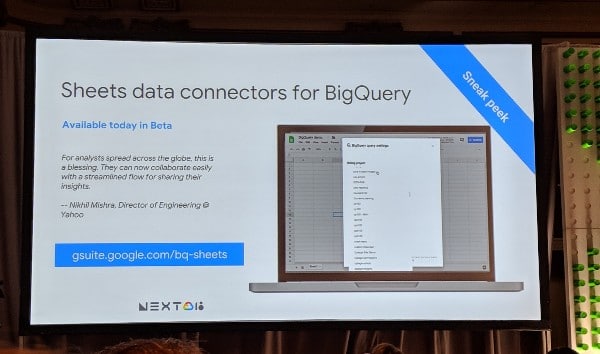
BigQuery Data Integration (sneak peek)
There’s been a huge buzz around BigQuery this week, so it was only natural that they announced a native connector for Sheets and BigQuery. It’s in beta pre-release at the moment.
I’ve enjoyed learning more about BigQuery this week and I’m really excited to start using it to build data pipelines involving Sheets and/or Data Studio.
Partner Integrations (sneak peek)
The team announced several new data integrations during the session. They spent time discussing what they’re working on to bring data from web services into Sheets so you can analyze it.
Three new integrations were announced:
Salesforce and Sheets
You’ll soon be able to export Salesforce data into Sheets with a single click. Salesforce will also be rolling out a feature where you can work on your data in a Google Sheet that is embedded inside of Salesforce.
Sheets saved in Box
You’ll soon be able to work with Google Docs but save the files into your Box account, i.e. use Box instead of Drive as your cloud storage. This makes a lot of sense if you’re already setup on the Box platform.
The team did a live demo showing the collaborative features live from a Box hosted Google Slide deck. Super slick!
SAP to Sheets
You’ll soon be able to export directly from SAP to Sheets.
Other notable updates in the works
> Text to columns will soon support fixed width splits, which is a useful upgrade.
> Continuing improvement of the Explore feature, which lets users ask questions about their data and uses natural language machine learning to extract answers and suggest insights.
> Improved printing options to meet enterprise needs.
> Images in cells, which stay with that cell even when you move it or insert other rows or columns. Currently you can insert floating images or use the IMAGE function to insert into a cell. Neither is ideal however, so this is a nice touch.
The session recording
Check out the recording of the session from the Google Next 18 conference:
Thanx Ben for exciting news. I am also eagerly waiting for all these updates.
I’ve one wish to the following upgrade which is already implemented:
Even more useful though, pivot tables now have the option to group data (for example to group dates into months, or quarters etc.) and drill-down on data (so you can select an aggregated record and see all the data behind it with a single click).
I just wish there was a method/ option to go to the filtered sourced data as data drill option. Presently on double click for data drill a new tab is created which has very limited use in real life. If double click shows the original data source with appropriate filters that will be of immense use in real life.
Something like what has been done for excel in this article https://www.contextures.com/xlPivot-Filter-Source-Data.html
Hi Ben,
Do you have an update on when slicers will be available for use in Google Sheets? Thanks!!
That is very very needed indeed…
Hi Ben
Any update on Slicers?
Slicers, please!!!
Still nothing 🙁
Slicers def needed!