Data Enrichment with the Google Tables Apps Script Bot

2024 Update: Table’s features and capabilities are now integrated into AppSheet. Read more here.

In this post, I’ll show you how to use the new Google Tables Apps Script Bot.

When something happens in your Google Table – a new row, or a value changes – a bot can be set to trigger an Apps Script function.

It opens up a world of new possibilities.

In this post, I’ll show you how to automatically enrich leads in Google Tables by retrieving data via the Mattermark API.

When I add a new company name into the first column, the new Google Tables Apps Script bot is triggered. The company name is passed to the Mattermark API and the relevant data is returned and finally added to that row in Google Tables.

Google Tables and Apps Script data bot

Google Tables Apps Script Bot

Bots in Google Tables are automated actions that you do tasks for you, without needing to write any code.

Bots have three components:

  1. Firstly, a trigger, which is a change in your Google Table that fires the bot
  2. Secondly, any specific conditions that control the behavior of the bot, for example which rows it operates on
  3. And thirdly, the action, i.e. what the bot does

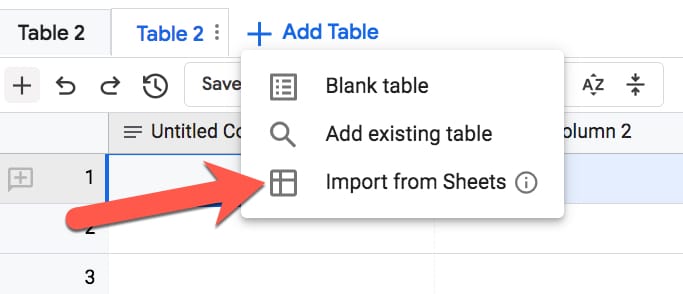
It’s this third option where we can choose to run an Apps Script file as the bot action.

The Google Tables documentation gives more background on executing Apps Script with bots.

Google Tables Apps Script Bot Example: Data Enrichment

In this example, we’ll use data from the Mattermark API to enrich company data in our Google Table.

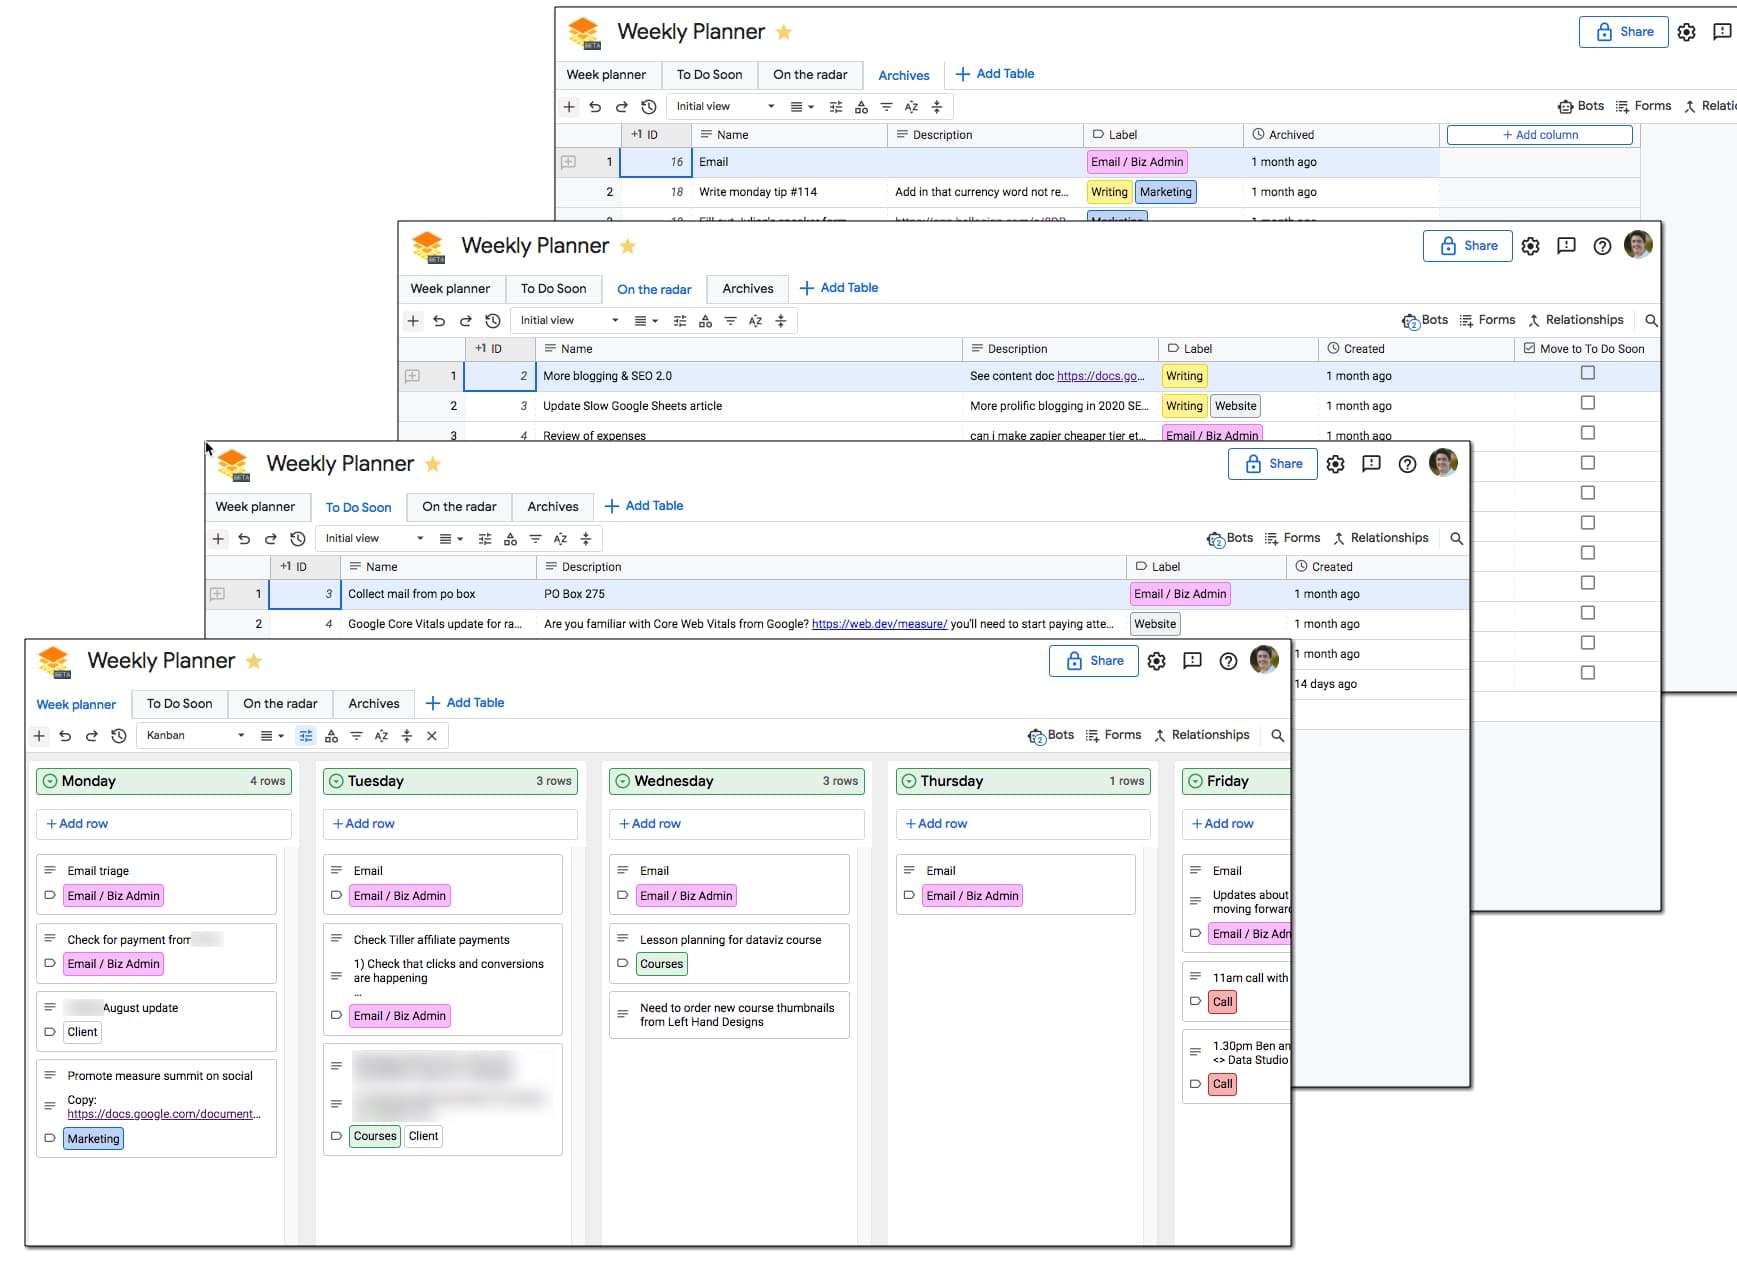
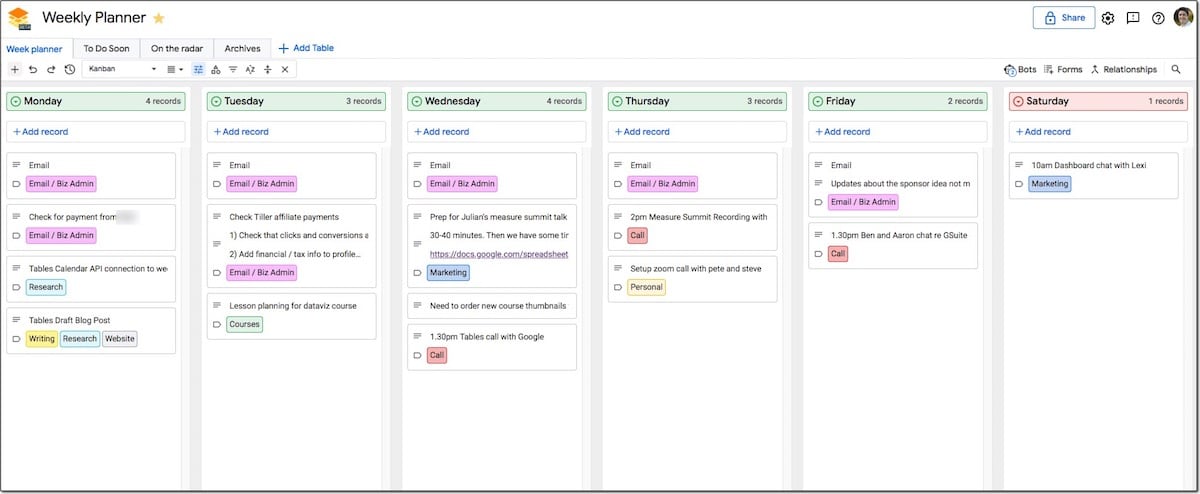
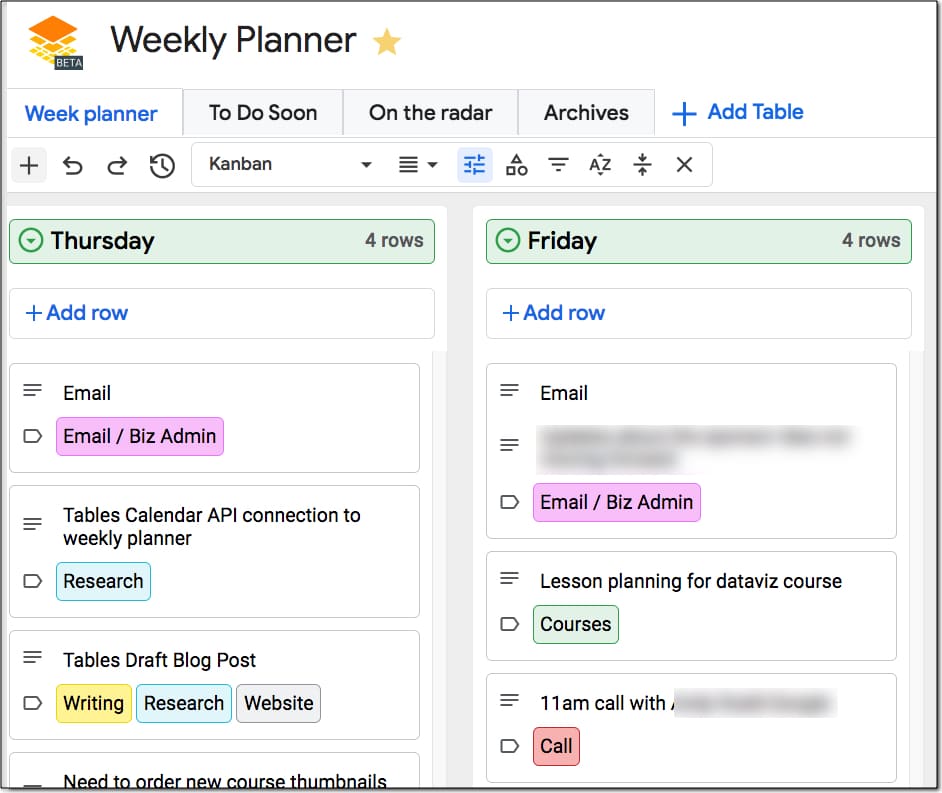
This is what the tool looks like in Google Tables:

Google Tables and Apps Script data bot

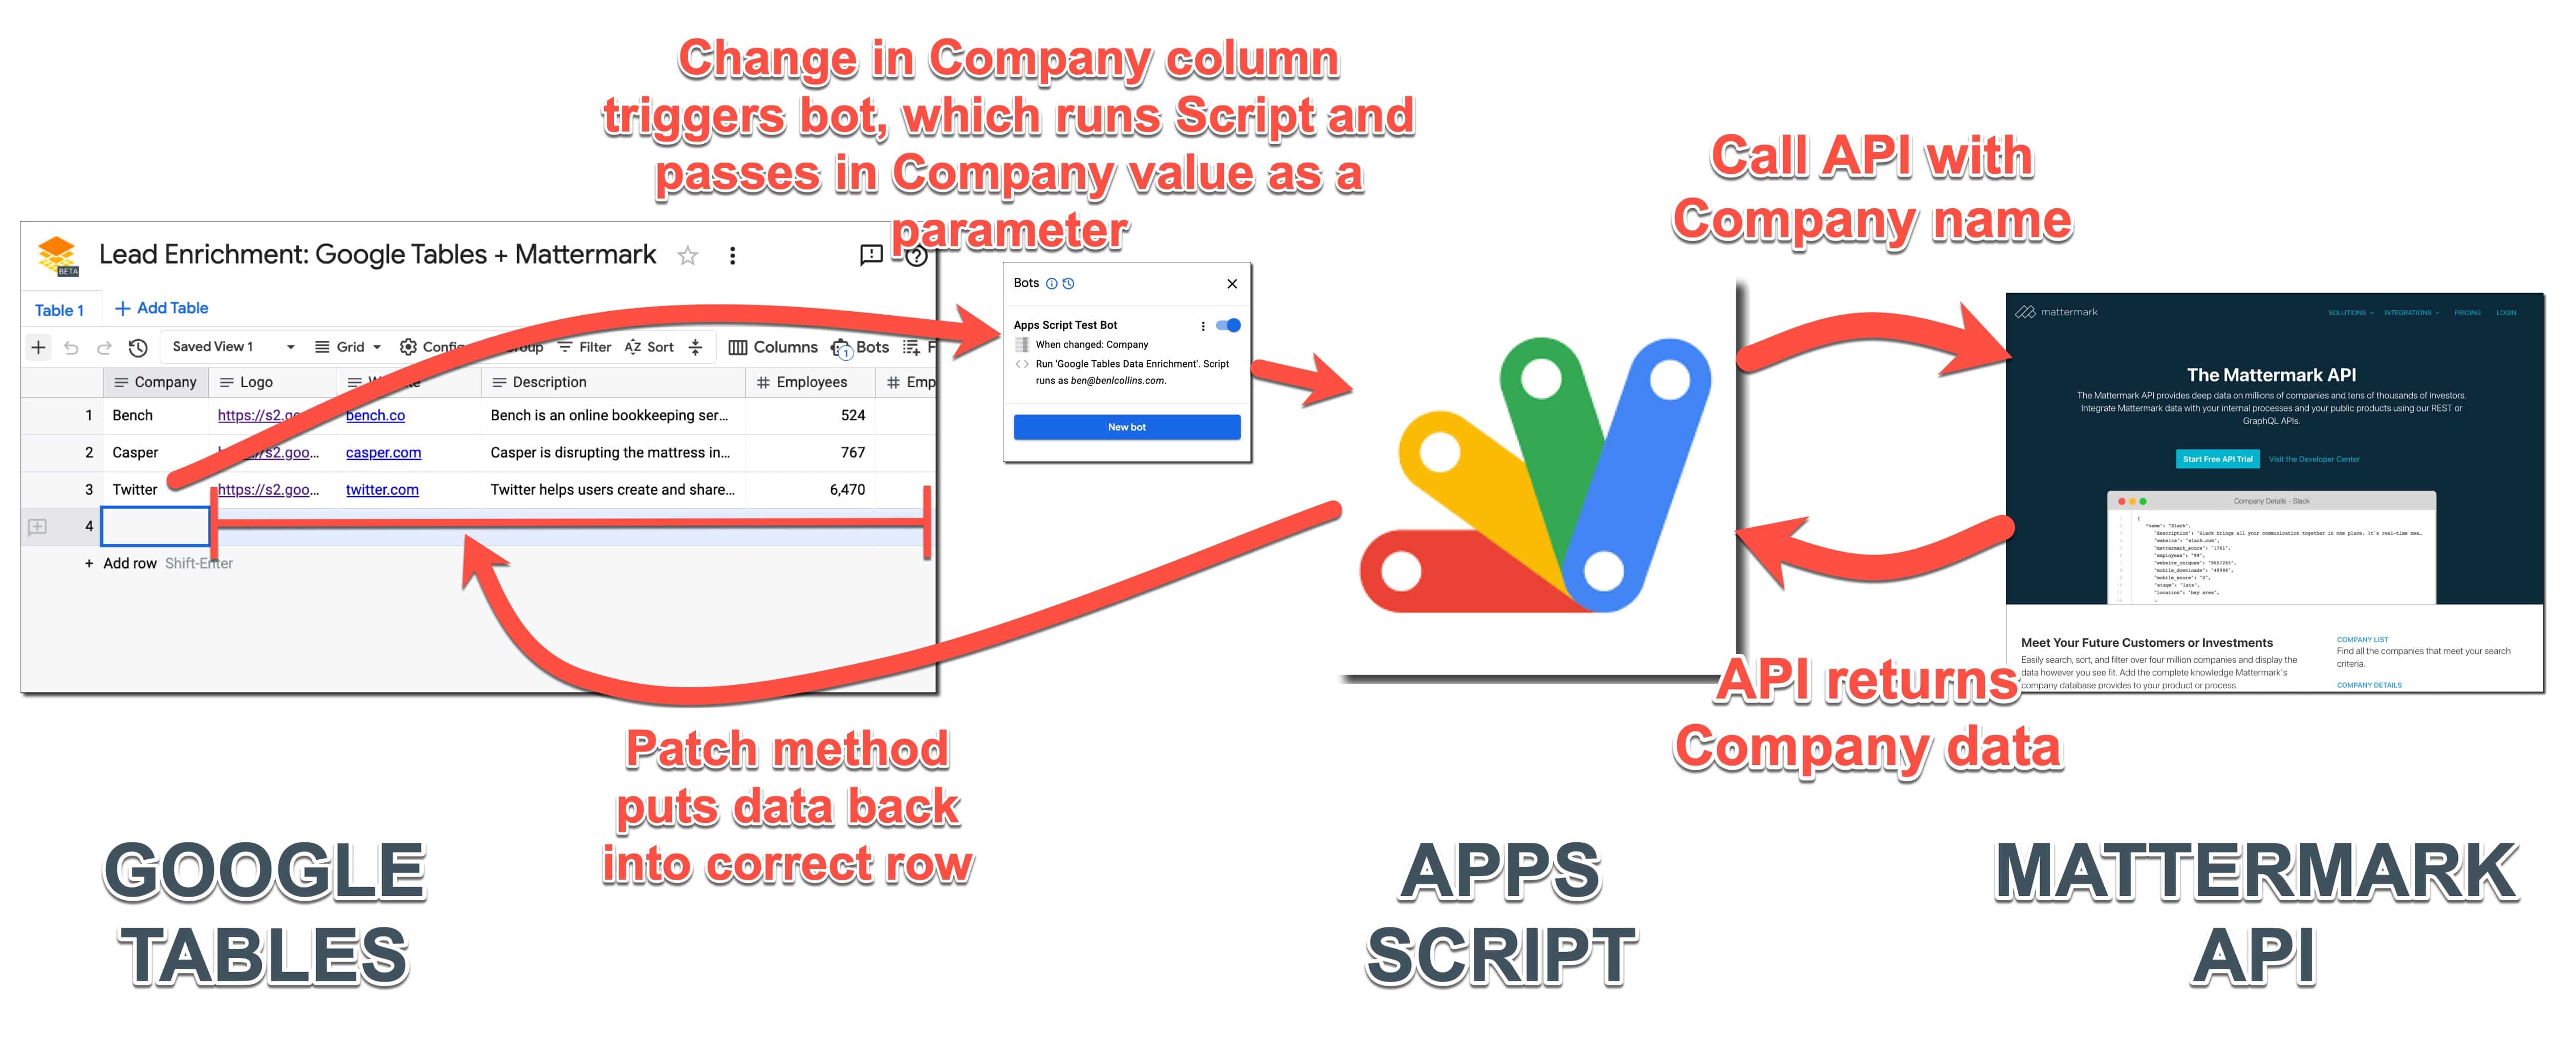
When you type the company name, e.g. “Casper”, into the first column, the Google Tables Apps Script bot is triggered. This runs the Apps Script file and passes in the Company name as a parameter.

After that, the script file calls the Mattermark API with this company name and retrieves additional data for this company.

Finally, the script file adds this data back into the correct row of Google Tables using the PATCH method.

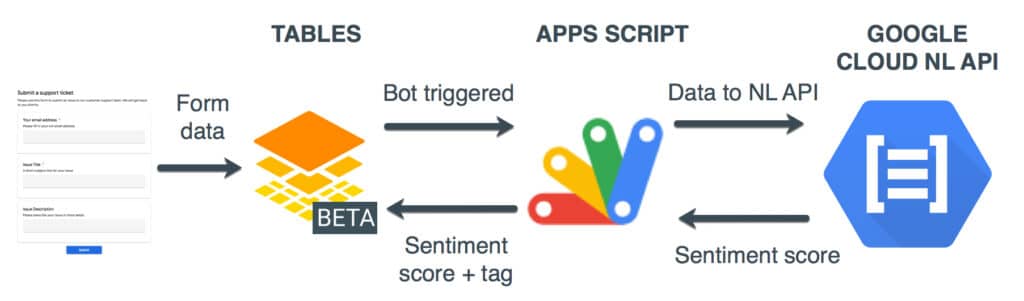
And here’s a flow chart of the overall workflow (click to enlarge):

Google Tables Apps Script Bot Data Enrichment Workflow

Google Tables Set Up

The first step is to create a new Google Table with the following columns:

Column HeadingData Type
CompanyText
LogoText
WebsiteText
DescriptionText
EmployeesNumber (integer)
Employees 6-Months AgoNumber (integer)
Revenue RangeText
Website UniquesNumber (integer)
Mobile DownloadsNumber (integer)
Funding StageText
Total FundingNumber (integer)
CityText
StateText
CountryText
Last updatedUpdate time

The only column that you’ll manually enter data into is the first column, Company, which holds the name of the company. The rest will all be populated by the script automatically (except the “Last updated” column which Tables takes care of).

Google Tables Bot

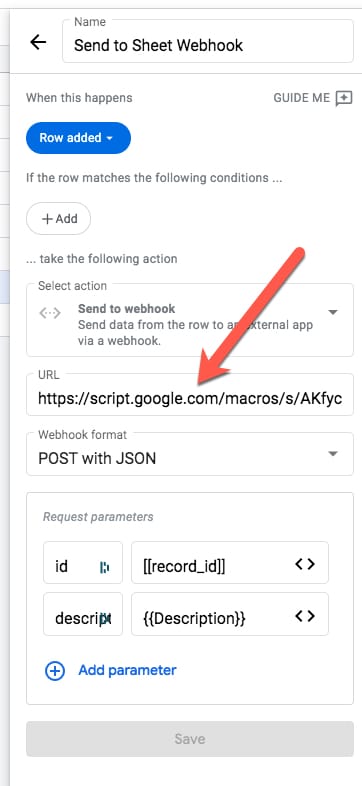
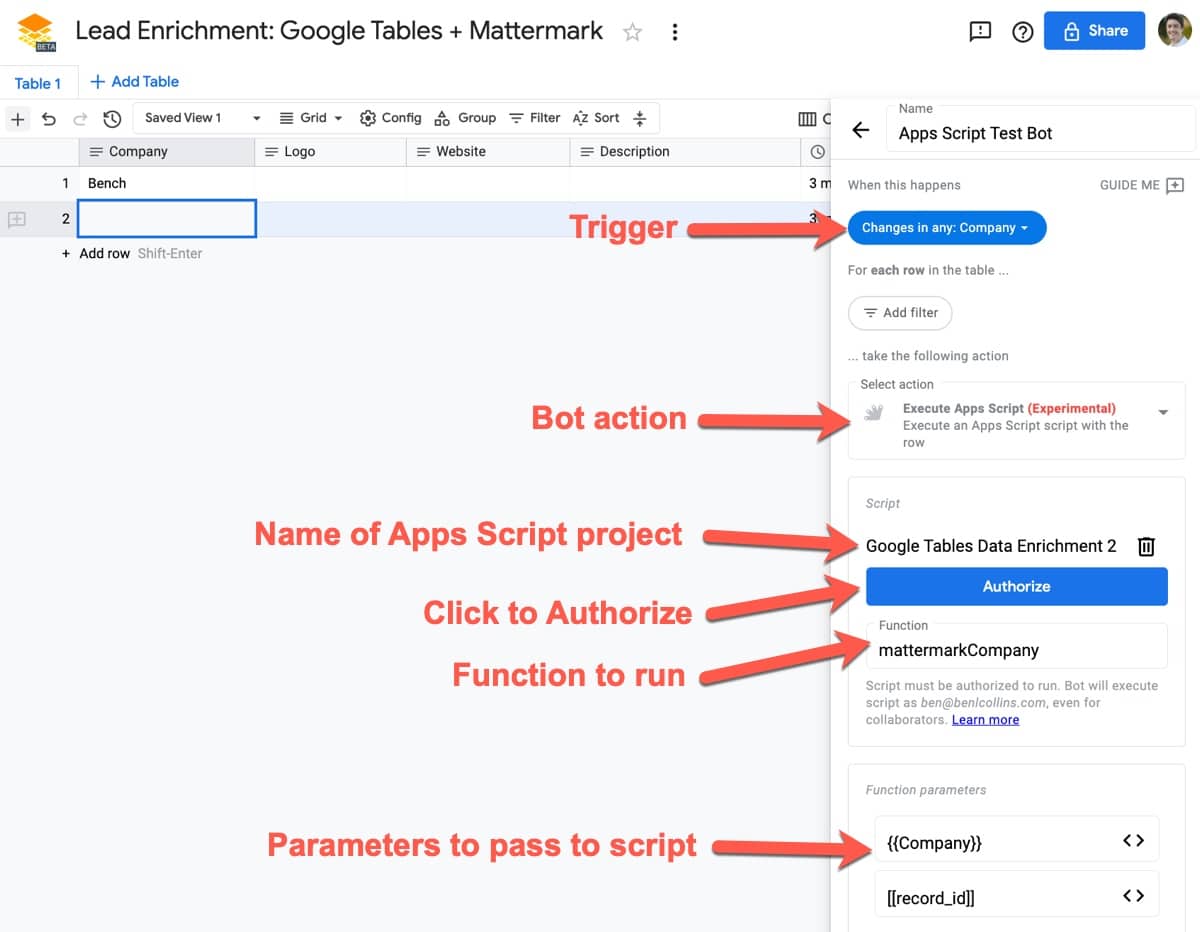
Next, create a bot with the following properties:

Trigger:
Changes in any: Company

Action:
Execute Apps Script

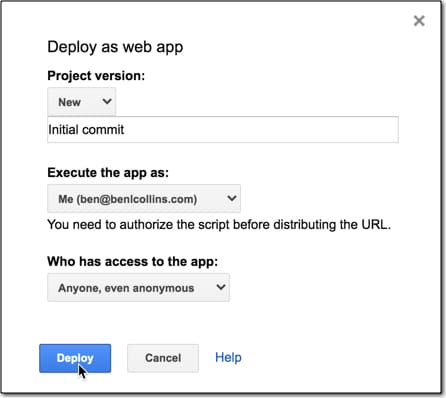
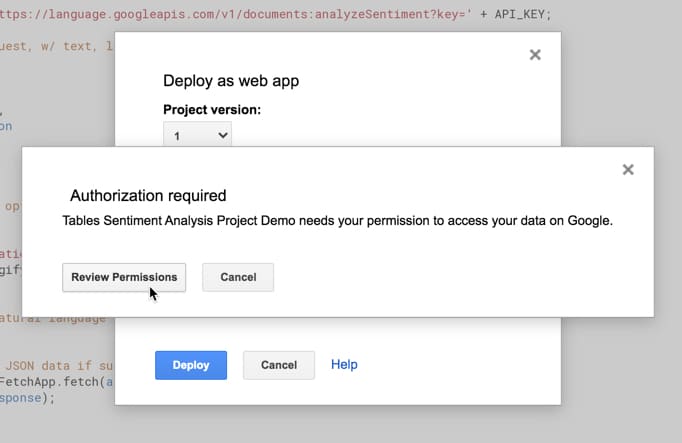
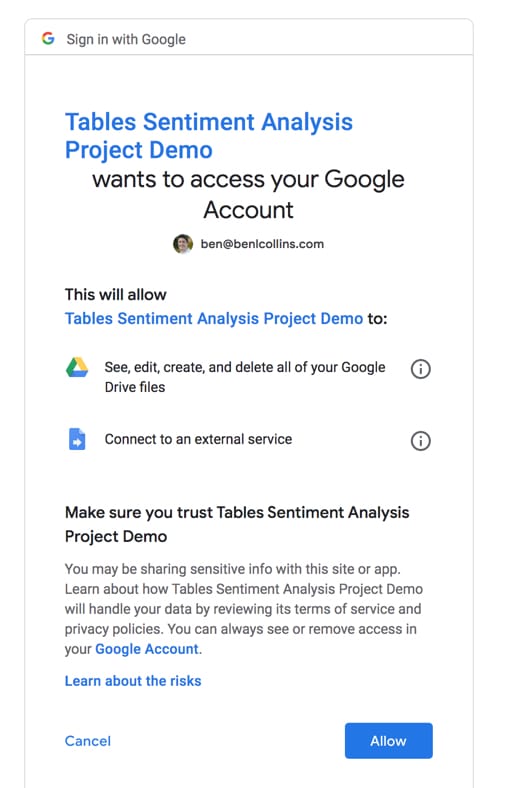
Then select the script file and function and authorize it (see below).

Function parameters:
{{Company}} – so we can search for it on the Mattermark API
[[record_id]] – the row ID for Google Tables so we can put the data back in the correct row

Here’s the bot setup in Google Tables (click to enlarge):

Google Tables Apps Script Bot Setup

Apps Script file

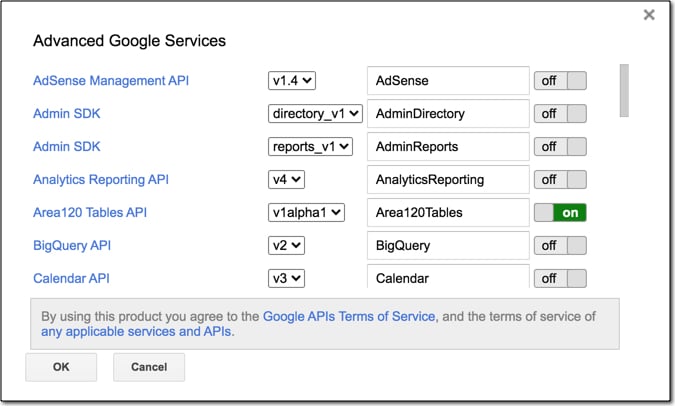
The Google Tables Advanced Service is required for this project, so that you can send data back into our Google Table.

Find it in under Services on the left sidebar, then search for Area120Tables. Add it to your project.

Once you’ve added this Service, you’ll notice your appsscript.json manifest file has been updated to include it as an enabled advanced service.

Next, add this script to the editor:

/**
 * Global Variables
 */
const API_KEY = ''; // <-- enter your Mattermark API key here
const TABLE_NAME = ''; // <-- enter your Google Tables table ID here

/**
 * function to retrive logo url
 */
function retrieveCompanyLogoURL(companyWebsite) {

	// example
	// companyWebsite = 'bench.co'

	// setup the api
	const base = 'https://s2.googleusercontent.com/s2/favicons?domain=';
	const url = base + companyWebsite + '&sz=32';

	return url;

}

/**
 * function to retrieve company data from Mattermark
 */
function mattermarkCompany(companyName,recordID) {

	// example
	// companyName = 'facebook'; 

	// set up the api
	const base = 'https://api.mattermark.com/';
	const endpoint = 'companies/'
	const query = '?key=' + API_KEY + '&company_name=' + companyName;
	const url = base + endpoint + query;

	// call the api
	const response = UrlFetchApp.fetch(url);
	const data = JSON.parse(response.getContentText());

	// parse the data
	const companies = data.companies;
	const firstCompany = companies[0];
	const companyID = firstCompany.id;

	console.log(companies);
	console.log(firstCompany);
	console.log(companyID);

	// call the api to get specific company details
	mattermarkCompanyDetails(companyID,recordID);

}

/**
 * function to retrive company details
 */
function mattermarkCompanyDetails(companyID,recordID) {

	// example
	// companyID = '159108';

	// set up the api
	const base = 'https://api.mattermark.com/';
	const endpoint = 'companies/' + companyID;
	const query = '?key=' + API_KEY;
	const url = base + endpoint + query;

	// call the api
	const response = UrlFetchApp.fetch(url);
	const data = JSON.parse(response.getContentText());
	console.log(response.getResponseCode());
	//console.log(response.getContentText());

	// parse data
	const companyWebsite = data.website;
	const companyDescription = data.description;
	const companyEmployees = data.employees;
	const companyEmployeesSixMonthsAgo = data.employees_6_months_ago;
	const websiteUniques = data.website_uniques;
	const mobileDownloads = data.mobile_downloads;
	const fundingStage = data.stage;
	const totalFunding = data.total_funding;
	const city = data.city;
	const state = data.state;
	const country = data.country;
	const revenueRange = data.revenue_range;

	// add company logo data
	const companyLogo = retrieveCompanyLogoURL(companyWebsite);

	const enrichmentData = {
		'Logo': companyLogo,
		'Website': companyWebsite,
		'Description': companyDescription,
		'Employees': parseInt(companyEmployees),
		'Employees 6-Months Ago': parseInt(companyEmployeesSixMonthsAgo),
		'Revenue Range': revenueRange,
		'Website Uniques': parseInt(websiteUniques) || 0,
		'Mobile Downloads': parseInt(mobileDownloads) || 0,
		'Funding Stage': fundingStage,
		'Total Funding': parseInt(totalFunding),
		'City': city,
		'State': state,
		'Country': country
    };
    console.log(enrichmentData);

	// send data back to Google Tables
    const rowName = 'tables/' + TABLE_NAME + '/rows/' + recordID;
    Area120Tables.Tables.Rows.patch({values: enrichmentData}, rowName);

}

The code can be found here on GitHub.

Script Notes

It’s a rough first draft! I’ve noted some improvements below.

Line 26: The mattermarkCompany function calls the API with the Company name to retrieve the Company ID.

It then calls mattermarkCompanyDetails function and passes in the Company ID.

Line 42: You’ll notice that I chose the first item of the company data array, regardless of whether this is the correct company. This was a shortcut to test out this idea.

Although this will often work, it won’t always grab the correct data because there could be multiple companies with the same name and you actually want the second one in the list. For a more robust tool, this would need to be developed further (noted in the improvements section below).

Line 57: The script calls the API again (a different endpoint) with this ID to get the additional data.

Subsequently, the script parses the returned data and puts it into an object (line 91).

Line 110: This line is the PATCH method to add the new data back into the correct row of my Google Table.

Script Improvements

There are a number of improvements that could be made:

  • Include error handling when no company data is found.
  • Deal with the multiple company scenario discussed above.
  • The Google Tables PATCH method could be moved into its own function, to further improve the code organization.
  • Include more data specific to the scenario (Mattermark has way more than I used in this example).

Sadly, I’ve used up my trial quota on the Mattermark API. Unfortunately, they only have annual plans available at over $1k, so for now, I’m not going to develop this any further.

In Summary

To sum up, the new Google Tables Apps Script bot is a great addition to Google Tables.

It opens up the door to all sorts of interesting automations with other Google Workspace tools or third-party services.

For example, suppose you have a Google Table of your employees and you add a new hire. This could trigger a bot that runs an Apps Script file to generate all the onboarding docs for that new employee, pre-filled with their data.

I’m excited to keep using it and see how else I can integrate Google Table automation into my workflows.

Sentiment Analysis For Google Tables Using Apps Script

2024 Update: Table’s features and capabilities are now integrated into AppSheet. Read more here.

In this post we’ll use Google Cloud’s Natural Language API to do sentiment analysis on tickets submitted to a Google Tables Support Issue Tracker.

We’ll use Google Tables as the platform for our Support Tracker and Apps Script to connect to the Cloud Natural Language API.

Here’s a GIF showing a portion of the Issue tracker to illustrate what happens when an issue ticket is submitted:

Sentiment Analysis Google Tables

The description (which someone fills out when they submit a support ticket) is sent to the Natural Language API for sentiment analysis, to determine if it’s positive (i.e. good) or negative (i.e. bad) feedback.

This information is returned to our Google Tables table and displayed as a tag alongside each row, so that we can group tickets by sentiment.

For example, we may want to prioritize tickets that are either extremely positive or extremely negative, as these are probably the most important items to double down on or fix!

Sentiment Analysis Google Tables Overview

Here’s the architecture of the system:

Google Tables Sentiment Analyzer architecture

In words:

  • User submits support ticket
  • New row of data added to our table
  • Bot is triggered and sends data to our Apps Script webhook
  • The Apps Script receives data and parses it
  • Apps Script sends data to Natural Language API
  • And receives the sentiment scores back from API
  • Apps Script parses score to create sentiment tag
  • And updates the original row of data in our table

This all happens in a under a second, so it feels almost simultaneous.

Inspiration for this idea came from the excellent sentiment analysis in Google Sheets post originally published by Alicia Williams.

Note: Since I’ve set this up using a webhook triggered by each new row, the API is called once for every new row. If we were building a high volume ticket system, we’d want to consider a different set up where we send the data through in batches and have the Apps Script running on a timer trigger instead.

Sentiment Analysis Google Tables Set Up

For this example, I’m starting with the default “New ? Support Ticket Queue” template from the Google Tables team.

1. Open Google Tables, login and select Templates > New ? Support Ticket Queue

2. Add three new columns: 1) Sentiment Score (number), 2) Sentiment Magnitude (number) and 3) Sentiment Tag (Tags).

3. Edit the new Sentiment Tag column and add the following tags: Super happy!, Happy, Satisfied, No opinion, Frustrated, Angry, Super angry!

Sentiment analysis tags in Google Tables

(You can edit these categories to whatever you want, but you’ll need them to match the tags in your Apps Script.)

Sentiment Analysis Apps Script Set Up

4. Create a blank Apps Script file in Drive or through the Apps Script dashboard

5. Clear out the boiler plate code and add the following code to declare the two global variables we need for this project (we’ll fill them in soon):

/**
 * global variables
 */
const API_KEY = ''; // <-- enter google cloud project API key
const TABLE_NAME = ''; // <-- enter google tables table ID

Since we just created our Table, let’s copy in the Table ID.

6. We find our table’s ID, by looking at the URL and copying the string right after /table/.

Table URLs can take the following form:

https://tables.area120.google.com/u/0/workspace/abcdefghijklmnop/table/TABLE_ID
https://tables.area120.google.com/u/0/table/TABLE_ID
https://tables.area120.google.com/u/0/table/TABLE_ID/view/abcedfghijk

Look for the string represented by the TABLE_ID in these fictional examples.

7. Paste this ID string into our Apps Script project, between the quotes in the line where we declare the variable TABLE_NAME:

const TABLE_NAME = ''; // <-- enter google tables table ID

Sentiment Analysis Google Cloud Set Up

This is probably the most difficult part of this whole project! 😉

For this to work, we need a Google Cloud account with billing set up. Don’t worry though, the Natural Language API is free for the first 5k “units” we use (each unit is worth 1000 characters). This is way more than we need to set this project up and test it out.

The full details of how to set up Google Cloud Natural Language API can be found in the documentation.

The steps to take are:

8. If you don’t already have a Cloud account, register for a Google Cloud account and set up billing.

9. Create a project in the Google Cloud account to use for this project.

10. Enable the Cloud Natural Language API, by clicking the link half-way down this page.

11. Create credentials for the Cloud Natural Language API. From the Cloud console choose the project we created in step 5 and navigate to APIs & Services > Credentials

Generate a new API Key through +CREATE CREDENTIALS > API key

12. Restrict the API key we generated to the Cloud Natural Language API

13. Copy the API key and paste it into our Apps Script file, between the quotes in the line where we declare the variable API_KEY (see code above):

const API_KEY = ''; // <-- enter google cloud project API key

Sentiment Analysis Google Tables Code

Staying in the Apps Script file, let’s add the webhook listener and main control function code for our program.

We use a special function called doPost(e) { } so that we can (eventually) publish our script as a web app. The doPost function sits there listening for a ping from our Google Tables bot (which we’ll set up later).

When a new row is added to our Google Table by a Form submission, the bot is triggered and sends the data we need through to our webhook.

This doPost function receives that data, parses it and sends it to the Natural Language API for sentiment analysis.

The returned sentiment data is parsed and sent back to our table to update the new row, using the patch method of the Area120Tables service.

14. Add the following doPost code:

/**
 * doPost webhook to catch data from Google Tables
 */
function doPost(e) {
  
  if (typeof e !== 'undefined') {

    // parse data
    const data = JSON.parse(e.postData.contents);

    // get the id and description
    const rowId = data.id
    const description = data.description;

    // analyze sentiment
    const sentiment = analyzeFeedback(description); // [nlScore,nlMagnitude,emotion]
    
    // combine arrays
    const sentimentArray = [rowId,description].concat(sentiment);

    // send score back to Google Tables
    const rowName = 'tables/' + TABLE_NAME + '/rows/' + rowId;
    const sentimentValues = {
      'Sentiment Score': sentiment[0],
      'Sentiment Magnitude': sentiment[1],
      'Sentiment Tag': sentiment[2]
    };
    Area120Tables.Tables.Rows.patch({values: sentimentValues}, rowName);

    return null;
  }
}

In the code above, we call a function called analyzeFeedback, so we had better declare it.

This function handles the logic around the NL scores and how to interpret them as human readable tags. Feel free to play around with the boundaries. The sentiment score is bounded between -1 (max negative) and 1 (max positive), but the magnitude only has a lower bound of 0, so can be any positive number.

For more about the interpretation of the sentiment scoring, have a read of this page in the documentation.

15. Add the following code to our Apps Script file to analyze the sentiment scores:

/**
 * Get each new row of form data and retrieve the sentiment 
 * scores from the NL API for text in the feedback column.
 */
function analyzeFeedback(description) {

  if (description !== '') {
      
      // call the NL API
      const nlData = retrieveSentiment(description);
      nlMagnitude = nlData.documentSentiment.magnitude ? nlData.documentSentiment.magnitude : 0; // set to 0 if nothing returned by api
      nlScore = nlData.documentSentiment.score ? nlData.documentSentiment.score : 0; // set to 0 if nothing returned by api
      //console.log(nlMagnitude);
      //console.log(nlScore);
    }
    else {
      
      // set to zero if the description is blank
      nlMagnitude = 0;
      nlScore = 0;

    }

    // turn sentiment numbers into tags
    let emotion = '';
    
    // happy
    if (nlScore > 0.5) { 
      
      if (nlMagnitude > 2) { emotion = 'Super happy!'; } // higher magnitude gets higher emotion tag
      else { emotion = 'Happy'; }

    }
    
    // satisfied
    else if (nlScore > 0) {  emotion = 'Satisfied'; }

    // frustrated
    else if (nlScore < 0 && nlScore >= -0.5) { emotion = 'Frustrated'; }

    // angry
    else if (nlScore < -0.5) { 
      
      if (nlMagnitude > 2) { emotion = 'Super angry!'; } // higher magnitude gets higher emotion tag
      else { emotion = 'Angry'; }
    
    }

    // if score is 0
    else { emotion = 'No opinion' }

    return [nlScore,nlMagnitude,emotion];
}

Finally we need to declare the function called retrieveSentiment to actually call the API.

16. Add the code to call the NL API:

/**
 * Calls Google Cloud Natural Language API with string from Tables
 */
function retrieveSentiment(description) {
  
  //console.log(description);

  const apiEndpoint = 'https://language.googleapis.com/v1/documents:analyzeSentiment?key=' + API_KEY;
  
  // Create our json request, w/ text, language, type & encoding
  const nlData = {
    document: {
      language: 'en-us',
      type: 'PLAIN_TEXT',
      content: description
    },
    encodingType: 'UTF8'
  };
  
  //  Package all of the options and the data together for the call
  const nlOptions = {
    method : 'post',
    contentType: 'application/json',  
    payload : JSON.stringify(nlData)
  };
  
  //  Try fetching the natural language api
  try {
    
    // return the parsed JSON data if successful
    const response = UrlFetchApp.fetch(apiEndpoint, nlOptions);
    return JSON.parse(response);
    
  } catch(e) {
    
    // log the error message and return null if not successful
    console.log("Error fetching the Natural Language API: " + e);
    return null;
  } 
}

Press save!

The full code is available here on GitHub.

Since we’re using the Area 120 Tables Apps Script service, we need to enable it for this project.

17. Go to Resources > Advanced Google services… and switch on Area120 Tables API:

Apps Script Advanced Services

Publish As Web App

18. Publish this file as a web app via the menu: Publish > Deploy as a web app…

19. Set the access to Anyone, even anonymous, as shown in this image:

Apps Script deploy as Web App

We’ll be prompted to review permissions:

Google Tables Sentiment Analyzer authorization

followed by a review of the project scopes:

Apps Script scopes

Click Allow.

This is a one-time step the first time we publish to the web or run our script (unless we add additional services in the future).

20. Copy the URL of the web app so we can paste that into our Tables bot, which we’ll create next!

Sentiment Analysis Tables Bot Set Up

The final piece of the puzzle is the bot in Google Tables.

When the issue tracker form is submitted it creates a new row of data in our table, which triggers the bot. The bot sends the data to the webhook (i.e. the code above) that handles the rest.

21. Create a new bot with the following specification:

Trigger: row added
Action: Send to webhook
Webhook URL: Our Apps Script web app URL from step 20
Webhook format: POST with JSON
Request parameters:
id : [[record_id]]
description : {{description}}

Visually, this is the bot:

Google Tables bot

The red arrow indicates where we paste the Apps Script web app URL.

Test The Sentiment Analysis Google Tables Tool

Finally, we’re ready to submit the form.

22. From the Google Table, click on the Support Ticket Form to open it in a new tab:

Google Tables Support Tracker Form

23. Submit it with a strong positive or negative sentiment in the description field (which is the one we send to the Natural Language API) to test out the Natural Language scores.

You’ll see the row of data arrive when we submit the form and then, a few moments later, the sentiment analysis columns get automatically populated too!

Sentiment Analysis Google Tables

That’s it! Let me know how you get on in the comments.

Google Tables: How I Use Google’s New Workflow Tool

2024 Update: Table’s features and capabilities are now integrated into AppSheet. Read more here.

2020 Launch: Here’s something to get excited about: Google just launched a new workflow automation tool!

Google Tables is a tool for teams and businesses that combines the flexibility of a spreadsheet with the power of a database.

Best of all, it provides a more visual way to present information than a spreadsheet.

There are so many ways to use this tool, and I’ll show some of them later in this post. I could see teams and individuals using it to organize and track projects for both work and home life, similar to how many people already use tools like Trello, Asana or Airtable — and yes, there’s even a kanban view!

Google Tables frees your data from boring spreadsheets and puts it into dazzling Tables like this:

Google Tables Bug Tracker

Then you can group and link these tables into Workspaces to create process workflows:

Weekly Planner workspace with 4 tables

Finally, sprinkle them with automation magic to save yourself time, using customizable, no-code Bots:

Google Tables no-code bot
No-code bot to move a record from the Weekly Planner Table to the Archive Table

What is Google Tables?

Spreadsheets excel (sorry!) at working with small tabular datasets. They’re perfect for analyzing your business data or keeping track of your finances.

But even if you love spreadsheets as much as I do, they’re not suitable for everything.

We’re all guilty of using spreadsheets to do things they’re not designed for.

For example, they’re not the best tool for managing workflows and automating multi-step processes. Spreadsheets set up like that often end up being complex and unwieldy to use.

Those workflows we track with spreadsheets — managing events, onboarding new hires, managing complex projects, etc. — are better suited to managing with this new Google Tables tool.

Google Tables is a product from Area 120, Google’s in-house incubator.

Google Tables Basics

Tables are the fundamental construct of the Google Tables product. They’re containers that hold structured data, i.e. ordered data recorded in rows.

Workspaces are collections of Tables grouped together. Tables can belong to multiple workspaces. When you open a workspace, you open all the Tables included in that workspace.

Columns in each Table are strongly-typed, meaning the data type you store in that column is predefined when you select the column type. This is different from a spreadsheet where you can store any type of data in any cell (unless you have data validation in place).

Views are saved versions of a Table with the data shown in a specific way. You can have multiple saved versions of a single Table, for example with different filters applied.

How much does Google Tables cost?

Google Tables is generally available to anyone with a Google account in the US at the moment.

Every country has different rules and norms around data privacy etc. so the team is starting in the US and will expand around the world in time. If you’re outside the US, you can express your interest via this form.

It’s currently a beta version, which means the product is still evolving and improving.

Free and paid tiers are available.

The paid tier costs $10/month and gives you additional storage, more tables and more bot (automation) actions. There’s a 3-month free trial of the paid tier, so you can try out all the features.

How I Use Google Tables

I’ve had access to the alpha version of Tables for the past 6 months. It’s quickly become an indispensable tool for the day-to-day running of my business.

I use it for two major workflows at the moment:

  1. My weekly planner
  2. An issue tracker for my courses

I also plan to move several other workflows from Google Sheets into Tables in the near future: my site content planning / SEO spreadsheet, my newsletter tracker, and my business process directory.

Workflow 1: Weekly Planner Kanban Board View

For years I used Trello’s kanban board (card) layout to manage my business week-to-week tasks.

Now I use Google Tables to do that.

I use it as a sort of rolling 7-day calendar, but I prefer it to a calendar because of the flexibility it affords.

Ultimately, it’s a combination of Trello (kanban board) + Tasks (To-Do list) + Calendar (events).

Google Tables Weekly Planner

Zooming in a little, here’s an example of my tasks for a given day:

Google Tables Weekly Planner

Each record is a row of data in a Table, presented in the kanban board view. I can drag records to move tasks to a different day. I can easily add new tasks or notes, and I can archive tasks when I complete them, using a bot.

Automation With Bots

Bots are automations that carry out a predefined set of instructions. In Tables, bots are created without writing any code.

In this weekly planner, I use them to move records from one Table to another.

For example, I like to archive tasks when I complete them.

I check an archive checkbox and then a bot moves the record into the Archive table.

Google Tables no-code bot
No-code bot to move a record from the Weekly Planner Table to the Archive Table

You can do lots of other things with bots too.

They can be triggered when something happens (e.g. a record gets added), on a set schedule (daily or weekly) or even by another bot.

They can perform actions like modifying records, adding records, sending emails or pinging webhooks (to send a chat notification to Slack for example).

Accessing Tables With Apps Script

And yes, whilst we’re on the subject of automation, Tables has an API and is also accessible programmatically via Apps Script!

(Here’s a Google Apps Script explainer if you haven’t used it before.)

For Apps Script, you must first enable the Tables API under the Advanced Service menu. Then you can access Tables by the Table ID, found after the /table/ part of the URL.

A basic Apps Script code to get the Table rows looks like this:

var tableName = "tables/XXXXXXXXXXXXXXXX";
var tableRows = Area120Tables.Tables.Rows.list(tableName).rows;

Workflow 2: Issue Tracker For My Online Courses

The other workflow I’ve setup in Tables is an issue tracker for my online courses.

Whenever someone contacts me with an issue on one of my courses, I log it in this Table, with tags to indicate which course, how urgent it is, where I’m up to etc.

It’s much easier to organize and see the issues compared to a plain data table in a spreadsheet. It requires a lot less effort to view the information.

Here’s an example of the issue tracker in a simple Google Sheet:

Google Sheet bug tracker

And here is that same tracker in a Google Tables workspace:

Google Tables Bug Tracker

It’s pre-filtered by course and the information is organized and emphasized with the use of colored tags.

It’s much, much easier to navigate and get a sense of the overall picture.

Using Forms To Submit Tickets

Google Tables includes forms to allow users to submit data. These are not the same as G Suite Google Forms, but rather a form builder specific to the Tables product.

I’ve created a Form for my course issue tracker Table.

And now that Google Tables has officially launched, I can include this Form in my online school so students are able to submit tickets directly.

Google Tables Form

FAQ About How To Use Google Tables

Can I turn my existing Google Sheets into Tables?

Yes! When creating new Tables, you can import data directly from existing Google Sheets.

Tables Import From Sheets

How is Tables different from Google Sheets?

The simplest way I can describe it is that Google Sheets is for your data and Google Tables is for your information.

Google Sheets does calculations, summarizes large datasets and creates charts and dashboards. Tables doesn’t do any of those things.

Instead, Google Tables makes it easy to store and organize information, and automate actions. Tables lets you quickly create workflow documents that are easier to use than spreadsheet equivalents.

Should I move to Google Tables from Trello or Airtable?

The Kanban board layout within Tables is similar to how Trello operates. The bots in Tables allow you to automate tasks in a similar way to Trello’s Butler tool.

Google Tables is similar to Airtable in many ways too. Like Airtable, Google Tables combines some of the best features of spreadsheets with databases, to create an ideal small business workflow and information tool.

Trello and Airtable are more mature products so they do have deeper feature sets, but Tables is new and is bound to develop quickly. Google has deprecated products in the past but I think this is a great tool with enormous potential and I hope Google Tables becomes a major player in this space.

What Else Can You Do With Google Tables?

Google Tables is designed for businesses, so anytime you’re using spreadsheets for tracking a process, ask if that’s something better suited to Tables.

The Tables team has created a huge number of templates to get you started, everything from a Product Roadmap to an Employee Directory.

I plan to share more experiences, tips, and use cases for Tables in the coming months.

I’m really excited by this product and see so many opportunities in my own business to improve my existing processes.

Resources