The Complete Guide to Tables in Google Sheets

In this post, we’re looking at the new, powerful Tables in Google Sheets.
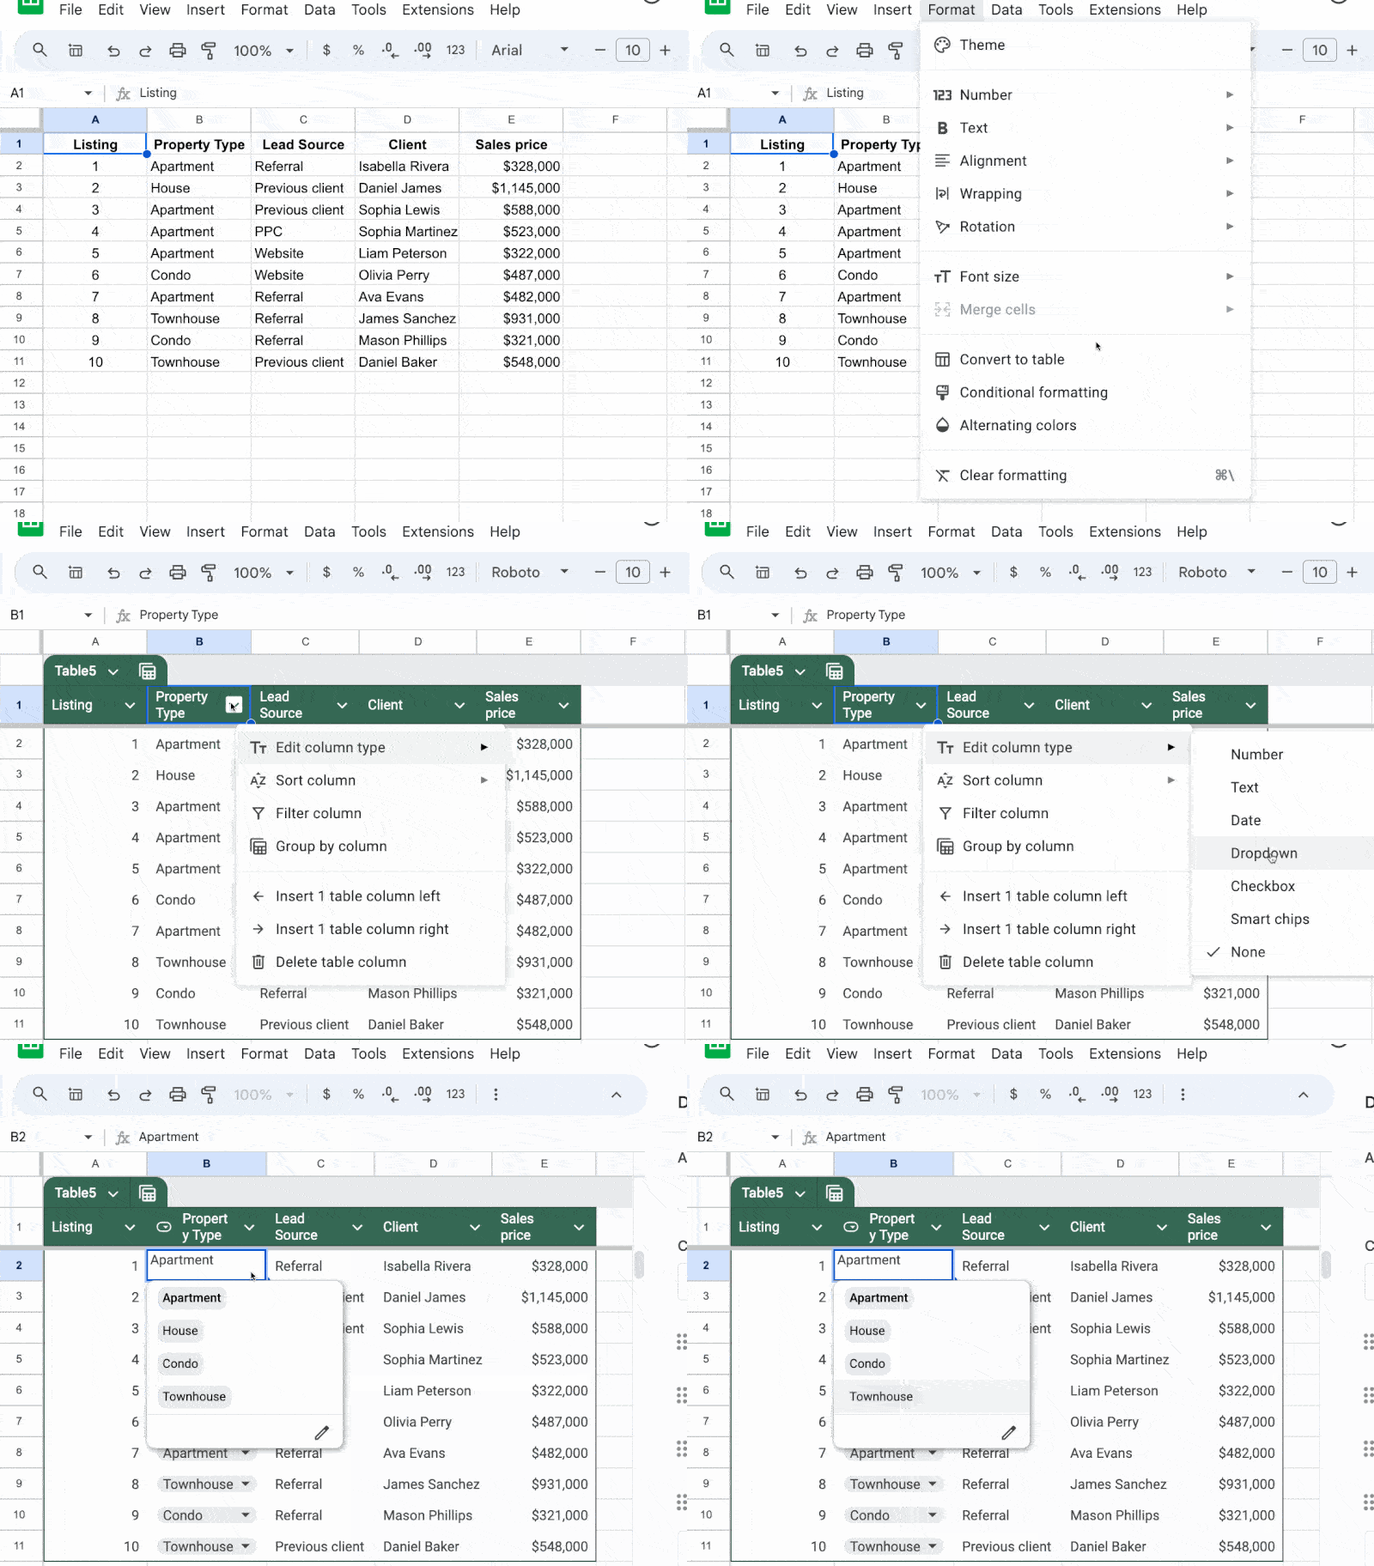
Tables In Google Sheets Animation

We’ll start with the basic benefits and features of Tables. Then we’ll look at how you can work with data with Tables using the new Views feature. After that, we’ll look at how to use Tables with formulas and structured table references.

What are Tables in Google Sheets?

Tables are a new feature in Google Sheets. They make it quick and easy to apply formatting and structural rules to a plain range of data.

There are a lot of benefits to using Tables to work with data (see below). I’m excited to use Tables in my Sheets workflows, especially the new Group By views.

Why should you use Tables?

There are many benefits to using Tables, including:

  • Quick and easy to apply formatting
  • Header row is automatically locked at the top of the Table
  • Nice selection of pre-built Table templates
  • Nice selection of pre-built styles
  • Super easy to add dropdowns or smart chips to columns
  • Formulas automatically applied down whole column
  • Formatting and calculations are applied automatically to new rows
  • Super easy access to filter and group by views
  • Some folks will love the Structured Table formula referencing
  • Built-in data validation with the column datatypes

When should you not use Tables?

Like any spreadsheet technique, Tables won’t be the best choice for every situation:

  • Tables might be confusing to people who are unfamiliar with them
  • They introduce additional complexity and clutter to Sheets that you might not want
  • The structured Table reference formulas can be confusing to the uninitiated
  • They work best with uniform underlying data. If your data has blank rows, subtotals, etc. then Tables may not interpret it correctly
  • It’s sometimes not possible to convert large, complex datasets into Tables

Tables Basics

Pre-Built Tables

Currently, when we open a new Google Sheet, we’re prompted to create a new Table with the Pre-Built Tables sidebar:
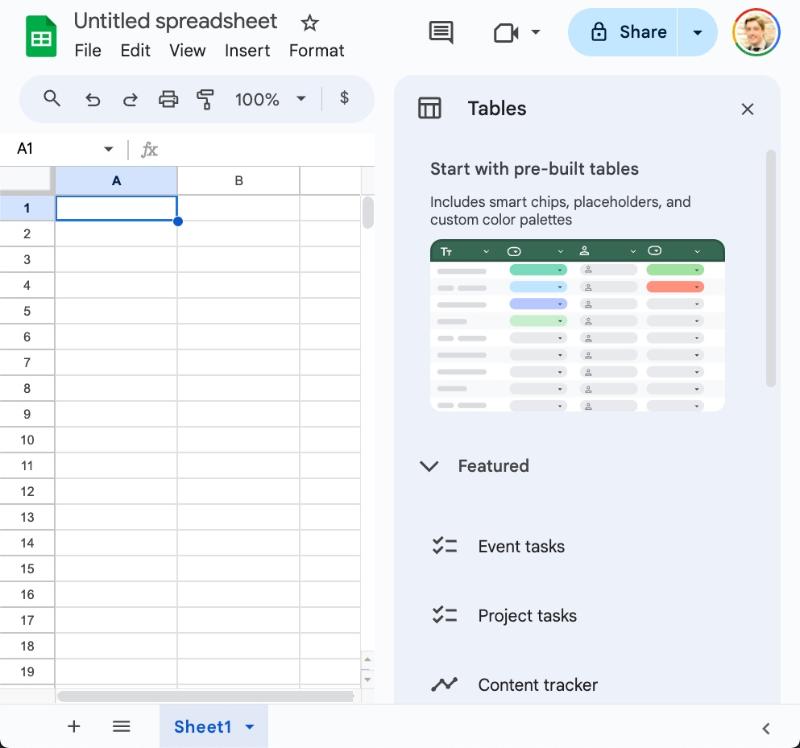
Pre-Built Tables in Google Sheets

Using this, we can insert a pre-built table with a single click.

I doubt this will always open by default. It’s a deliberate choice to expose more people to Tables since they’re a new feature.

I see this being very helpful for people earlier in their Sheets journey. It showcases some of the best features — dropdowns, smart chips, etc. — that many folks don’t know about.

Access the Pre-Built Tables sidebar from the menu: Insert > Tables
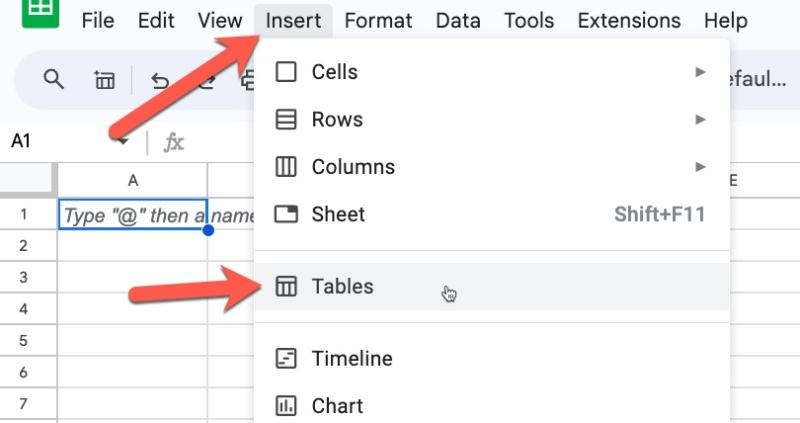
Insert Tables in Google Sheets

How to create Tables in Google Sheets

Now, suppose we already have this dataset in our Sheet:

Data in Google Sheets

Click on any cell in a dataset and convert it to a Table via this menu:

Format > Convert to table
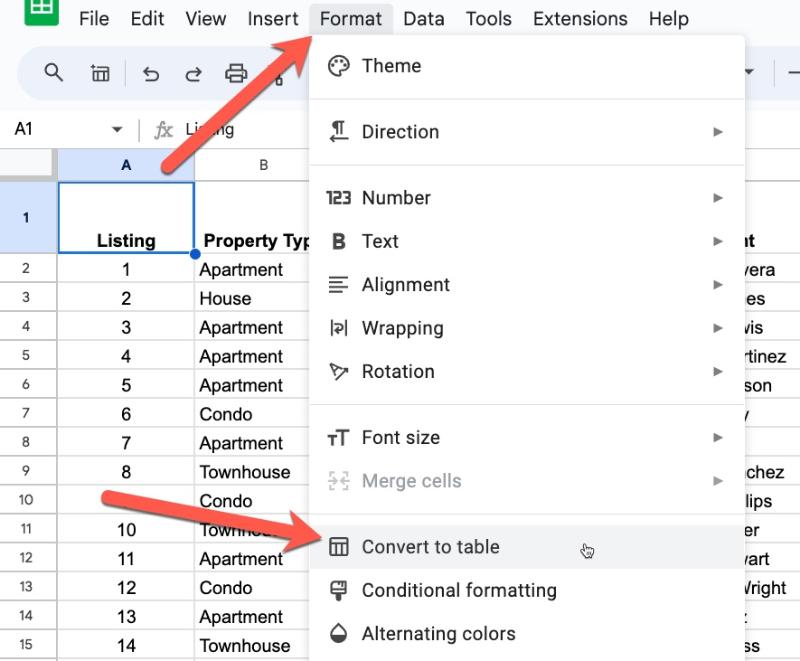
Format menu in Google Sheets

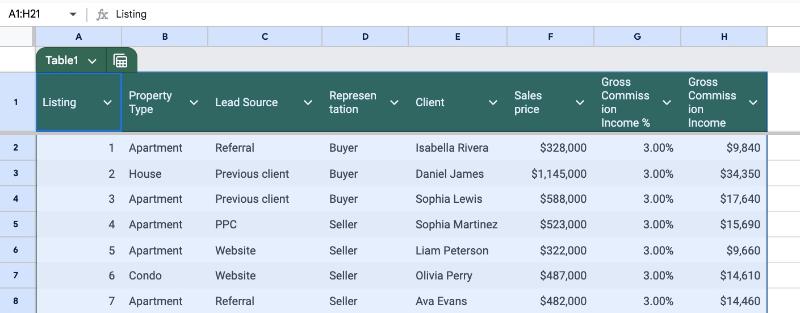
The new Table looks like this:

Tables in Google Sheets

Now we can enjoy all the benefits of Tables that we mentioned above!

The main Table Menu
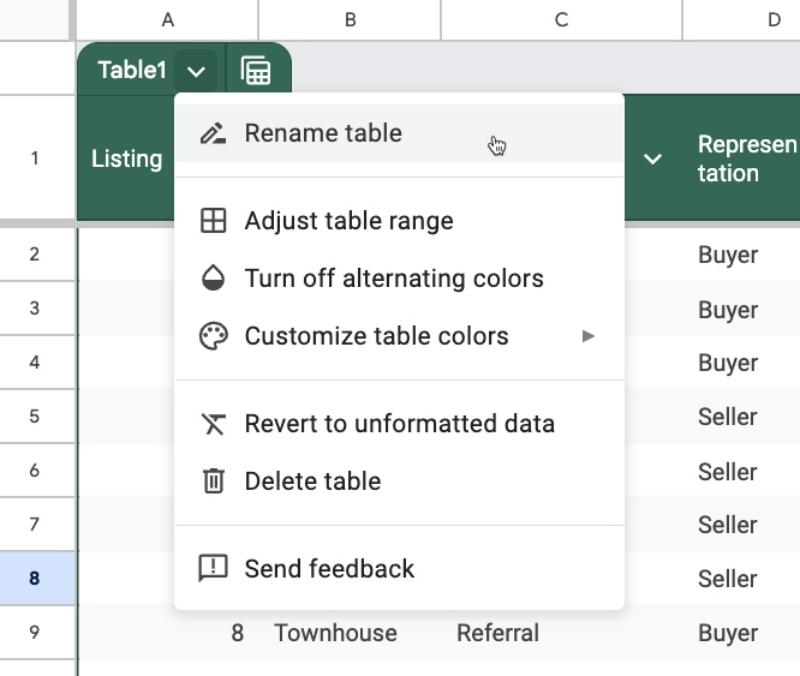
Table Menu in Google Sheets

Click on the down arrow next to the Table name in the top left corner of the Table to open the Table menu.

From this menu, we can rename the Table, change the formatting, apply custom formats, or even delete the Table.

Be warned: Deleting the Table also deletes the underlying dataset. Use the “Revert to unformatted data” if you want to return to your base data.

The Column Menu
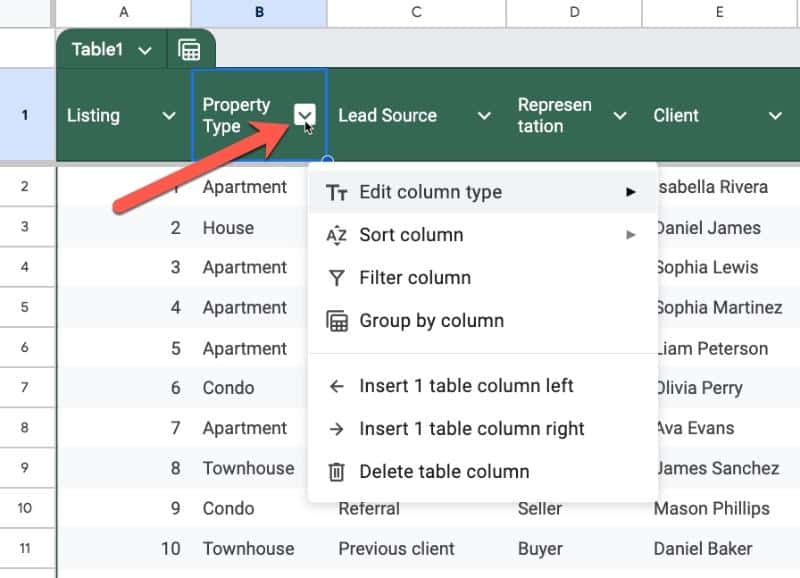
Column Menu in Tables feature of Google Sheets

Click on the down arrow next to each column heading to open the Column Menu for that column.

Here, we can set the datatype for the column (i.e. is it text? A number? A smart chip?). This is a powerful setting so worth taking time to get to know.

For example, we can set a column to dropdown type and it will convert the entire column in a single click.
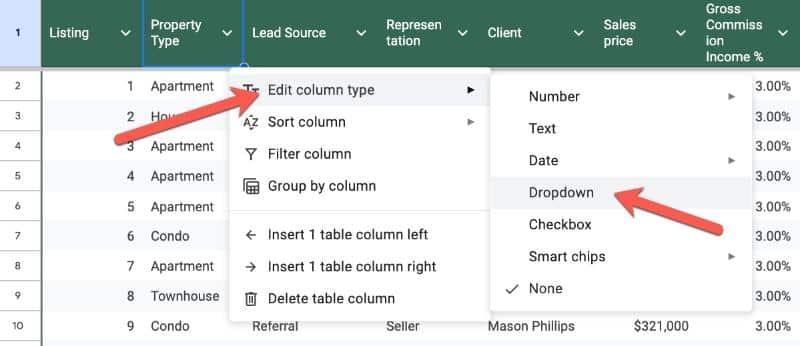
Dropdown option in Google Sheets Tables

We can also filter and group by columns, which we discuss below.

And, there’s an easy way to add or remove columns from this column menu.

Data Analysis Tools Within Tables

One of the main benefits to using Tables with our datasets is the built-in data analysis tools that we get.

Built-in Data Validation

Setting column types can feel like an additional burden, but there are benefits.

One of the main benefits is the automatic data validation it provides.

Here’s how it works.

Suppose we set our column to be a Currency type column. This is shown by a small icon next to the column name (the first red arrow).

Then along comes a colleague who enters a new row. But they accidentally type a name (or other word) into that number column.

The Table will add a red warning flag and error message to indicate invalid data in that column:
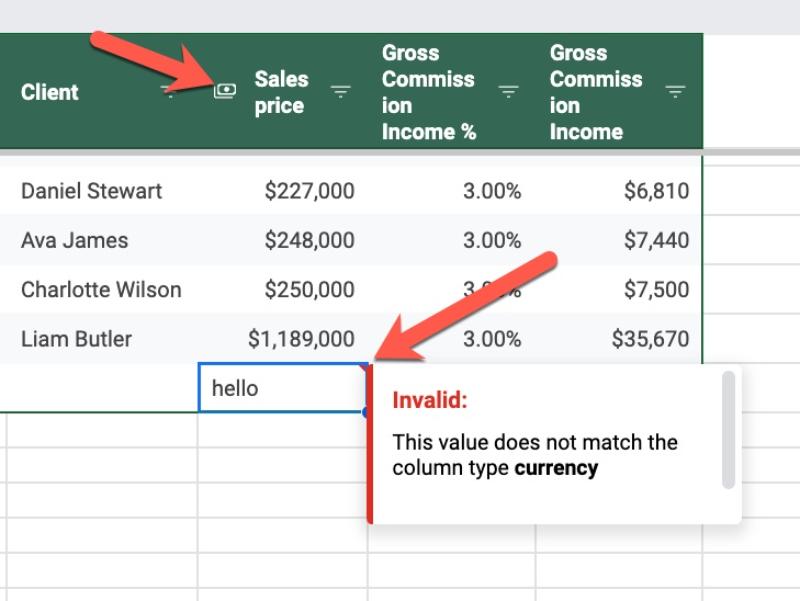
Data validation in Tables in Google Sheets

Table Views Menu

The Table Views menu is accessed from the Table icon next to the Table name, in the top left of the Table:
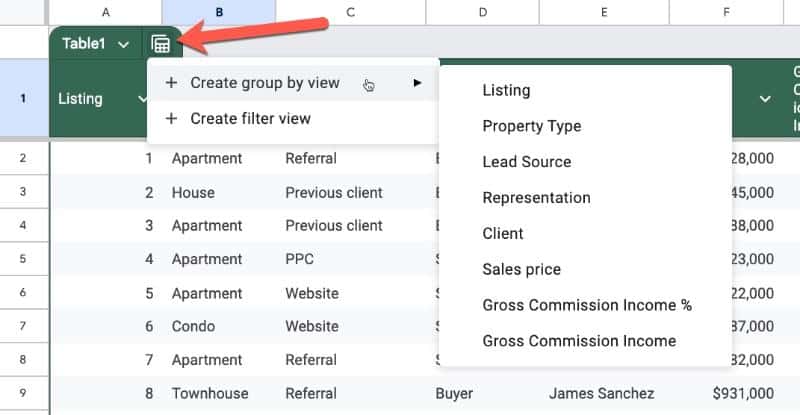
Table Views Menu in Google Sheets

Opening the Table view menu lets us create Group By or Filter Views, or access previously built views.

Group By Views

The new Group By View aggregates data into categories based on a selected column.

For example, we could group our data by property type with Group By View so that we can see all the groups together:
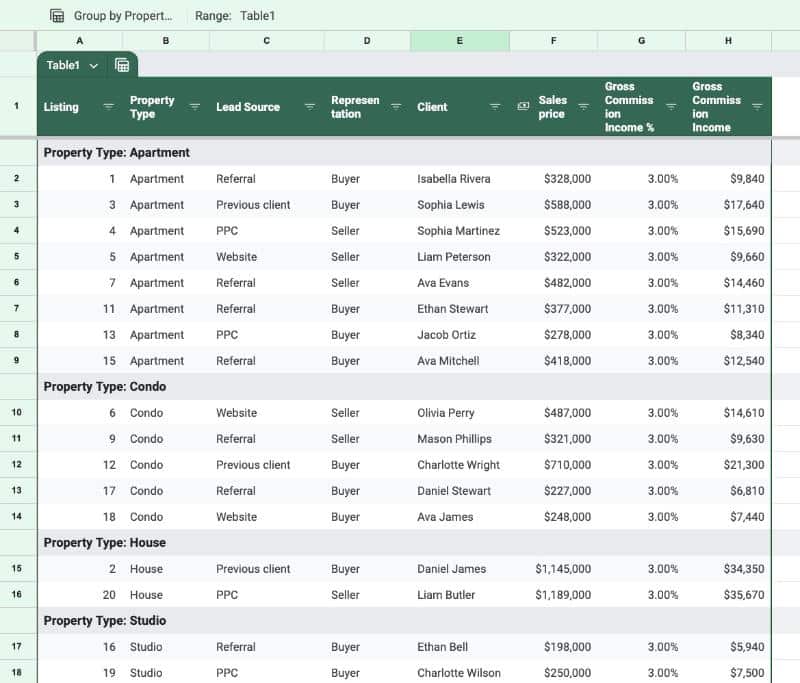
Group By Views in Google Sheets Tables

(One feature that is lacking with Group By Views is subtotal values for these groups. Fingers crossed we’ll get this in the future.)

Group By views can be created from either the Table View menu or from the selected Column menu.

To save a View (Group By or Filter) click on the “Save view” button:
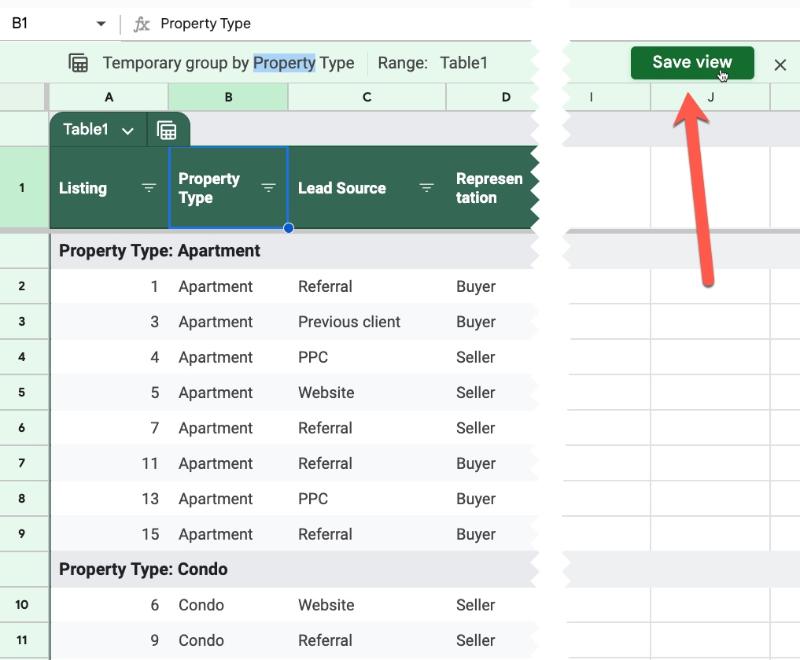
Save View in Google Sheets Tables

Give the view a name in the subsequent popup:
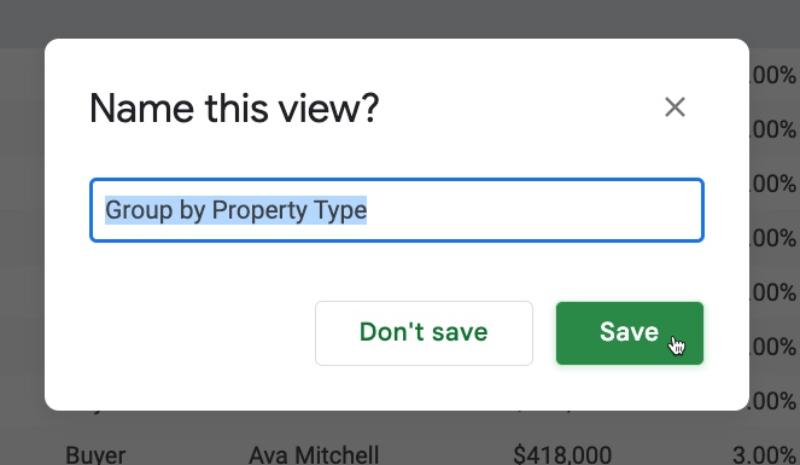
Name this view in Google Sheets Tables

Now, this view will always be accessible from the main Table Views menu:
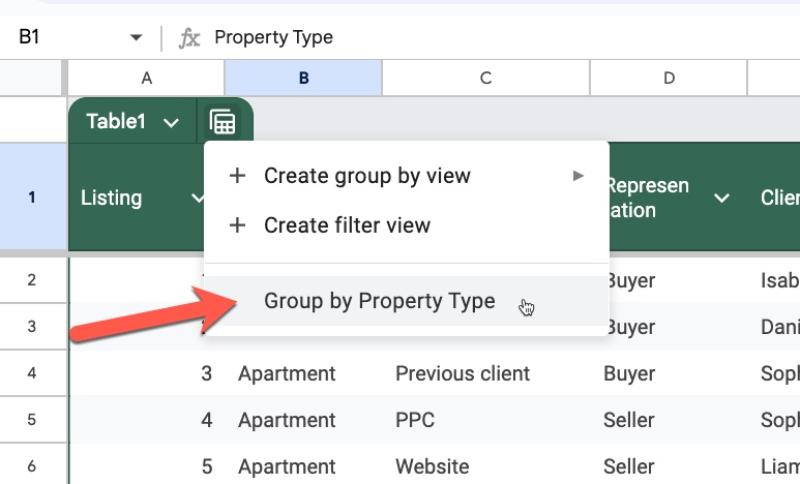
Group By View in Tables menu

To close a view and return to the main Table view, press the “x” button on the right side of the green view bar between the formula bar and the Sheet.
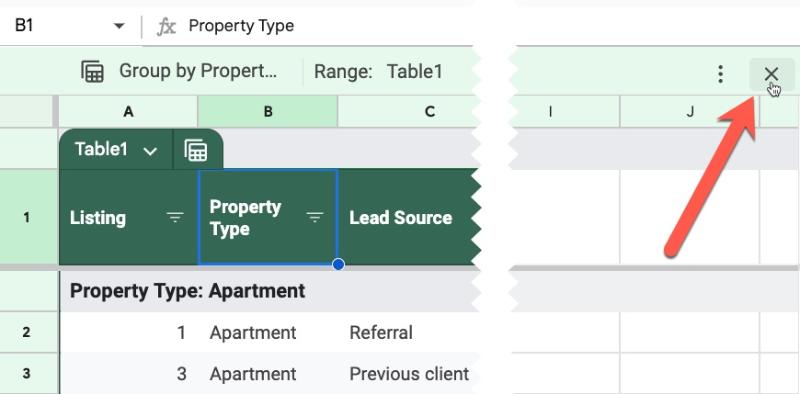
Close button for Table view

Tables Filters

Filters are a HUGELY useful tool for exploring our data. They let us select subsets of data to review, based on categories (e.g. all the records for Client A) or conditions (e.g. all values over $100).

But many people aren’t aware they exist or forget to use them.

With Tables, they are applied automatically so that we can start using them immediately.

Access the Filter options inside the Column menu.

Tables Filter Views

Suppose we create a specific filter (all transactions with Client A over $100 in value) that we want to review over and over. Or share easily with colleagues.

We can create a Filter view and save this particular set of filter conditions to return to in the future.

Formulas In Tables

If you add a formula to the first row of a Table, you’re prompted to fill the entire column with Suggested Autofill:
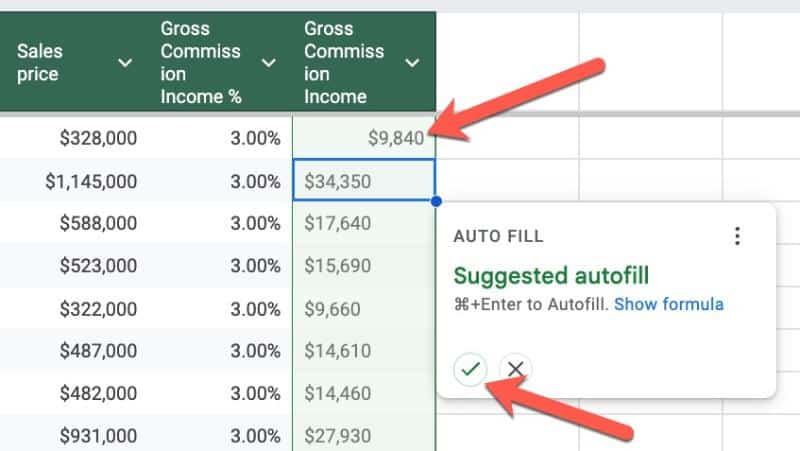
Autofill Column in Table Google Sheets

(Note: This is the same behavior as regular non-Table formatted data.)

Table Reference Syntax

Table References are a special way to access data inside a Table. Instead of A1-style cell references, we can use the Table name and Column headings in our formulas.

Let’s use this simple Table to illustrate the Table Referencing syntax:
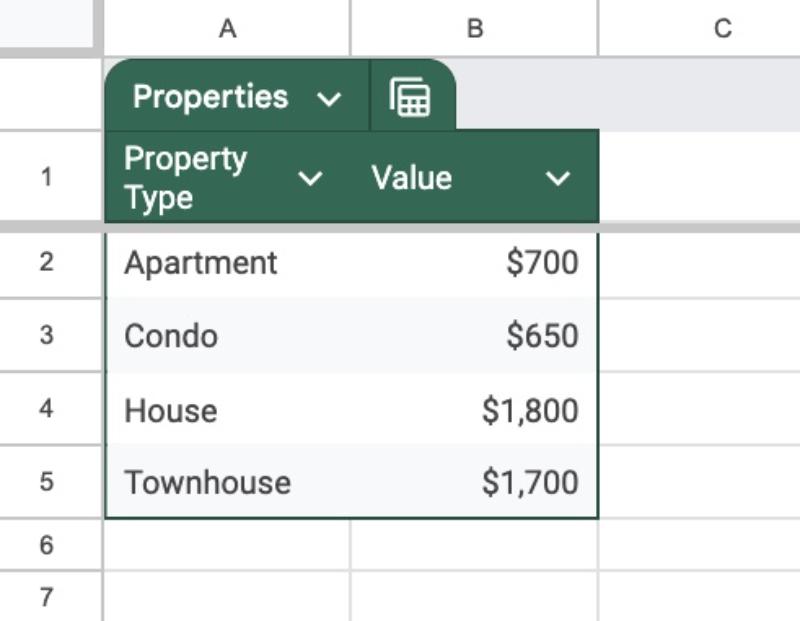
Tables in Google Sheets

I’ve named this Table Properties.

(Note: Table names can only contain letters and numbers and can’t start with a digit or have a space.)

Here’s how the Table Referencing works:

  1. Properties[#All] –> entire Table AND column headers
  2. Properties –> gets Table data only, NO column headers
  3. Properties[Column Name] –> gets data in named column only

(Note: column heading names CAN contain spaces, but must be unique within that Table.)

It’s easier to understand visually and I’ve added formulas to show how they work:
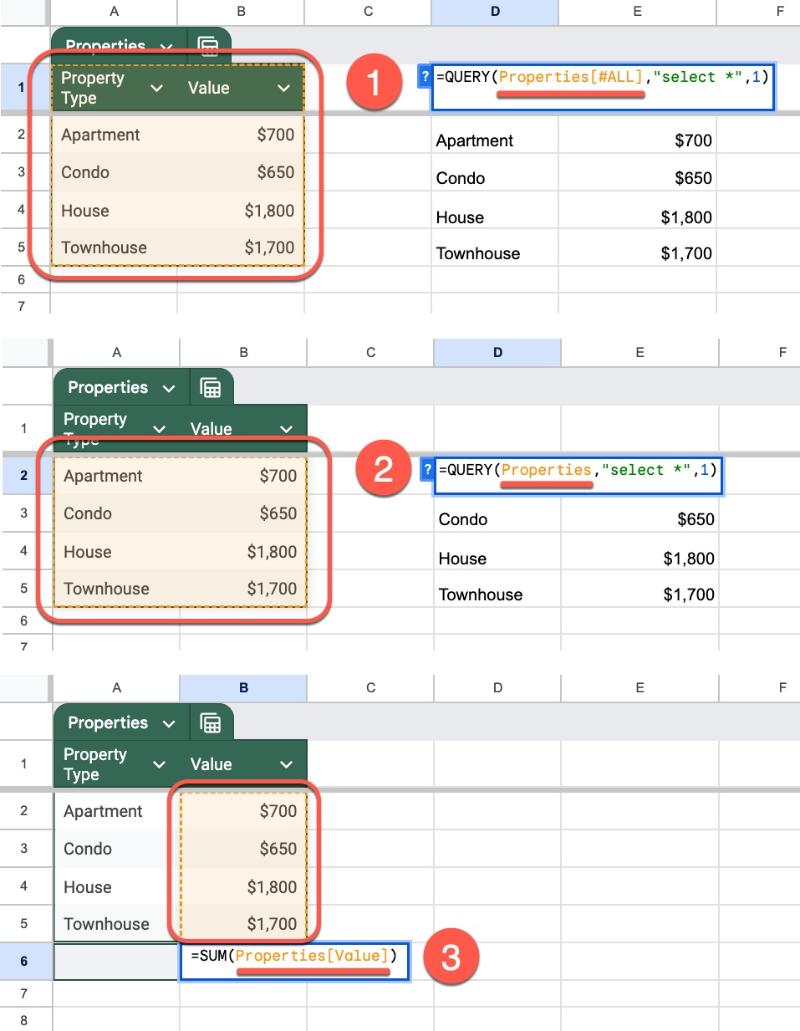
Table References in Google Sheets

If you’re familiar with ​Named Ranges​, then you’ll feel right at home using Table referencing.

(Note: you can still access cells inside Tables using regular cell references, e.g. =A1.)

Benefits of using Table References

There are a number of benefits to using Table References over standard A1-style cell references:

  • The formulas automatically update to include any new rows of data added to the Table
  • If you create, rename, insert, or delete columns in a Table, any Table References in formulas will automatically update too
  • Easier to create than regular cell references. It’s easier to type “Properties[Value]” than e.g. “Sheet6!B2:B6”
  • When you start typing a Table or Column name, the auto-complete box will show any Table References that you can quickly click

Using Table References in Formulas

Now we understand structured table references, let’s see them in action with a practical example.

Let’s say we have a Table of real estate transactions. We call it RealEstate2024 (remember, no spaces allowed in Table names).

Now suppose we want to lookup a client name from that Table to retrieve transaction details.

To do that, we’ll use an ​XLOOKUP formula​.

With our search term in cell G2 and using Table References, our formula is:

=XLOOKUP( G2 , RealEstate2024[Client] , RealEstate2024[Sales price] )

RealEstate2024[Client] refers to the “Client” column inside the “RealEstate2024” Table. Similarly, RealEstate2024[Sales price] refers to the “Sales price” column inside that same table.

In our Sheet, it might look like this:

Table References in Google Sheets

And here’s the equivalent A1-style formula:

=XLOOKUP( G2 , 'Copy of Sheet4'!D2:D21 , 'Copy of Sheet4'!E2:E21 )

The Table Reference version is definitely cleaner and easier to understand.

Plus, any new rows of data added to the Table will be automatically included by the formula. Whereas, with the A1-style formula, we’ll need to remember to update the range references.

Now, I’m not about to tell you that you can throw away your A1-style referencing!

Tables References are super useful and worth using if you have your data in a Table. However, A1-style references are more flexible and still necessary for more complex formulas.
Further Resoures

Tables Documentation from Google

Google Tables: How I Use Google’s New Workflow Tool

2024 Update: Table’s features and capabilities are now integrated into AppSheet. Read more here.

2020 Launch: Here’s something to get excited about: Google just launched a new workflow automation tool!

Google Tables is a tool for teams and businesses that combines the flexibility of a spreadsheet with the power of a database.

Best of all, it provides a more visual way to present information than a spreadsheet.

There are so many ways to use this tool, and I’ll show some of them later in this post. I could see teams and individuals using it to organize and track projects for both work and home life, similar to how many people already use tools like Trello, Asana or Airtable — and yes, there’s even a kanban view!

Google Tables frees your data from boring spreadsheets and puts it into dazzling Tables like this:

Google Tables Bug Tracker

Then you can group and link these tables into Workspaces to create process workflows:

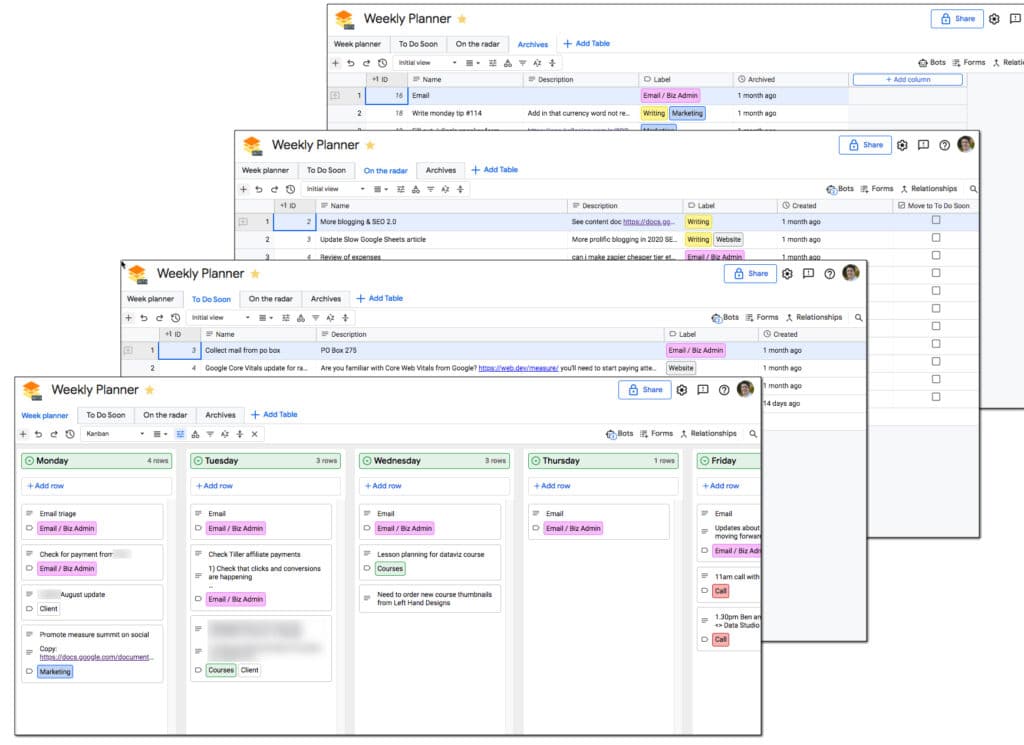
Weekly Planner workspace with 4 tables

Finally, sprinkle them with automation magic to save yourself time, using customizable, no-code Bots:

Google Tables no-code bot
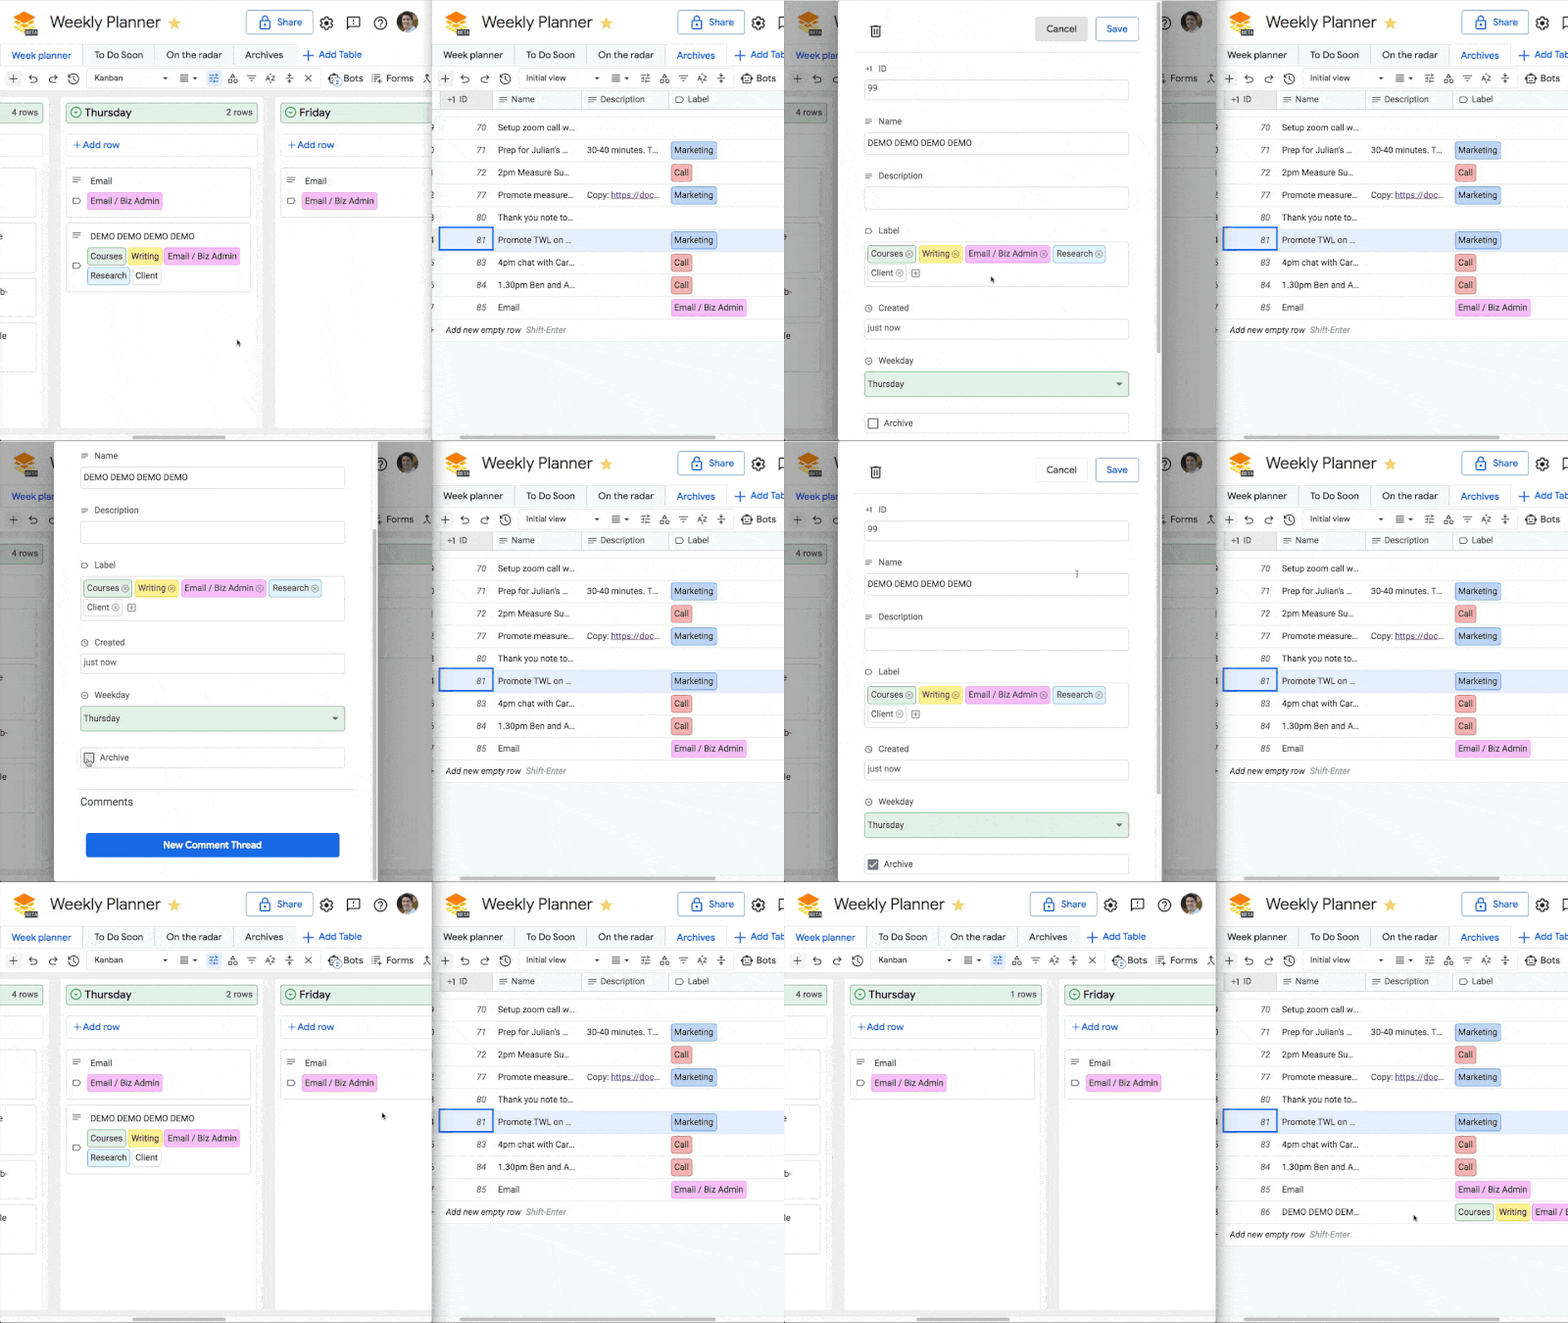
No-code bot to move a record from the Weekly Planner Table to the Archive Table

What is Google Tables?

Spreadsheets excel (sorry!) at working with small tabular datasets. They’re perfect for analyzing your business data or keeping track of your finances.

But even if you love spreadsheets as much as I do, they’re not suitable for everything.

We’re all guilty of using spreadsheets to do things they’re not designed for.

For example, they’re not the best tool for managing workflows and automating multi-step processes. Spreadsheets set up like that often end up being complex and unwieldy to use.

Those workflows we track with spreadsheets — managing events, onboarding new hires, managing complex projects, etc. — are better suited to managing with this new Google Tables tool.

Google Tables is a product from Area 120, Google’s in-house incubator.

Google Tables Basics

Tables are the fundamental construct of the Google Tables product. They’re containers that hold structured data, i.e. ordered data recorded in rows.

Workspaces are collections of Tables grouped together. Tables can belong to multiple workspaces. When you open a workspace, you open all the Tables included in that workspace.

Columns in each Table are strongly-typed, meaning the data type you store in that column is predefined when you select the column type. This is different from a spreadsheet where you can store any type of data in any cell (unless you have data validation in place).

Views are saved versions of a Table with the data shown in a specific way. You can have multiple saved versions of a single Table, for example with different filters applied.

How much does Google Tables cost?

Google Tables is generally available to anyone with a Google account in the US at the moment.

Every country has different rules and norms around data privacy etc. so the team is starting in the US and will expand around the world in time. If you’re outside the US, you can express your interest via this form.

It’s currently a beta version, which means the product is still evolving and improving.

Free and paid tiers are available.

The paid tier costs $10/month and gives you additional storage, more tables and more bot (automation) actions. There’s a 3-month free trial of the paid tier, so you can try out all the features.

How I Use Google Tables

I’ve had access to the alpha version of Tables for the past 6 months. It’s quickly become an indispensable tool for the day-to-day running of my business.

I use it for two major workflows at the moment:

  1. My weekly planner
  2. An issue tracker for my courses

I also plan to move several other workflows from Google Sheets into Tables in the near future: my site content planning / SEO spreadsheet, my newsletter tracker, and my business process directory.

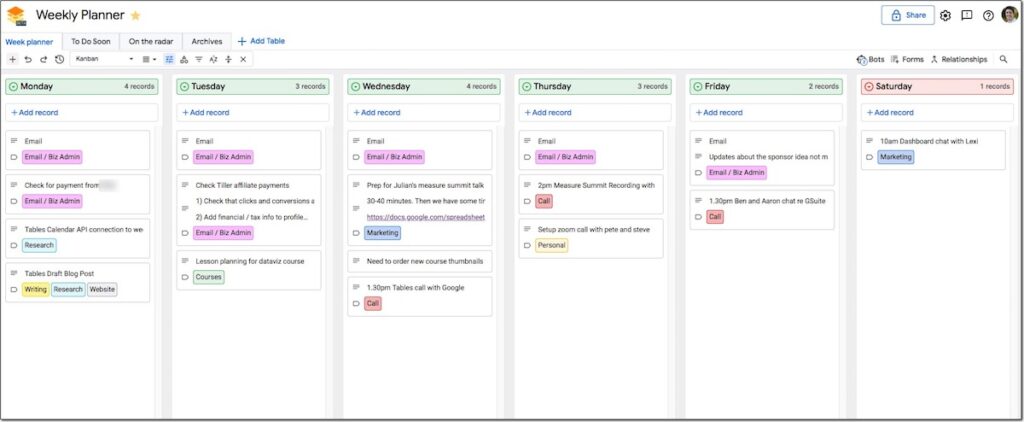
Workflow 1: Weekly Planner Kanban Board View

For years I used Trello’s kanban board (card) layout to manage my business week-to-week tasks.

Now I use Google Tables to do that.

I use it as a sort of rolling 7-day calendar, but I prefer it to a calendar because of the flexibility it affords.

Ultimately, it’s a combination of Trello (kanban board) + Tasks (To-Do list) + Calendar (events).

Google Tables Weekly Planner

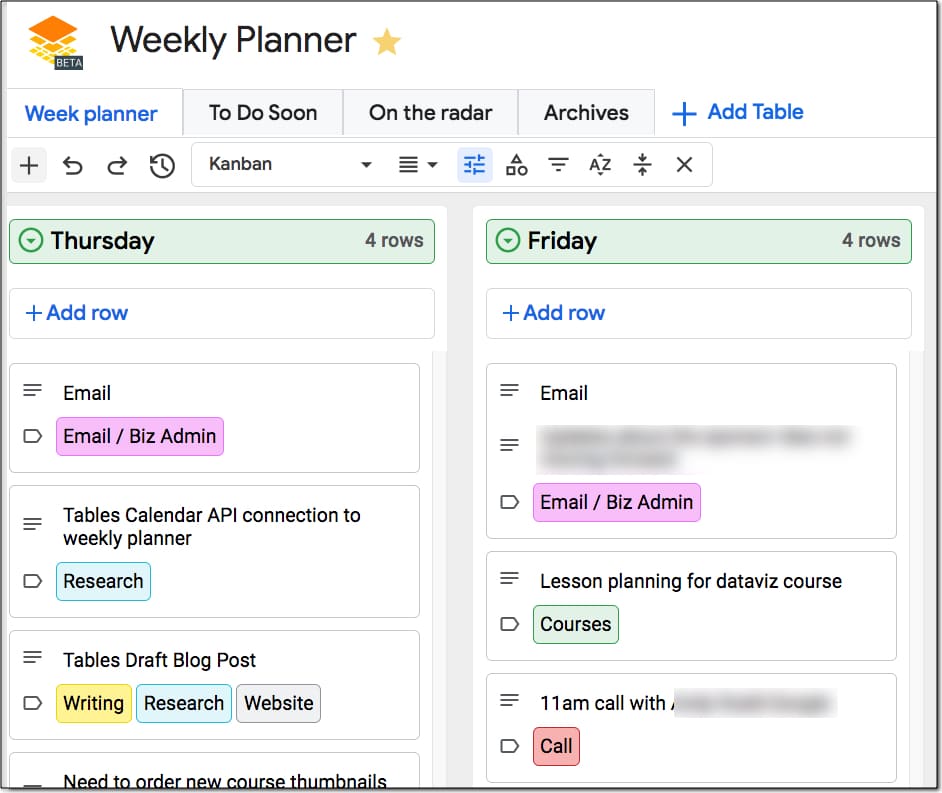
Zooming in a little, here’s an example of my tasks for a given day:

Google Tables Weekly Planner

Each record is a row of data in a Table, presented in the kanban board view. I can drag records to move tasks to a different day. I can easily add new tasks or notes, and I can archive tasks when I complete them, using a bot.

Automation With Bots

Bots are automations that carry out a predefined set of instructions. In Tables, bots are created without writing any code.

In this weekly planner, I use them to move records from one Table to another.

For example, I like to archive tasks when I complete them.

I check an archive checkbox and then a bot moves the record into the Archive table.

Google Tables no-code bot
No-code bot to move a record from the Weekly Planner Table to the Archive Table

You can do lots of other things with bots too.

They can be triggered when something happens (e.g. a record gets added), on a set schedule (daily or weekly) or even by another bot.

They can perform actions like modifying records, adding records, sending emails or pinging webhooks (to send a chat notification to Slack for example).

Accessing Tables With Apps Script

And yes, whilst we’re on the subject of automation, Tables has an API and is also accessible programmatically via Apps Script!

(Here’s a Google Apps Script explainer if you haven’t used it before.)

For Apps Script, you must first enable the Tables API under the Advanced Service menu. Then you can access Tables by the Table ID, found after the /table/ part of the URL.

A basic Apps Script code to get the Table rows looks like this:

var tableName = "tables/XXXXXXXXXXXXXXXX";
var tableRows = Area120Tables.Tables.Rows.list(tableName).rows;

Workflow 2: Issue Tracker For My Online Courses

The other workflow I’ve setup in Tables is an issue tracker for my online courses.

Whenever someone contacts me with an issue on one of my courses, I log it in this Table, with tags to indicate which course, how urgent it is, where I’m up to etc.

It’s much easier to organize and see the issues compared to a plain data table in a spreadsheet. It requires a lot less effort to view the information.

Here’s an example of the issue tracker in a simple Google Sheet:

Google Sheet bug tracker

And here is that same tracker in a Google Tables workspace:

Google Tables Bug Tracker

It’s pre-filtered by course and the information is organized and emphasized with the use of colored tags.

It’s much, much easier to navigate and get a sense of the overall picture.

Using Forms To Submit Tickets

Google Tables includes forms to allow users to submit data. These are not the same as G Suite Google Forms, but rather a form builder specific to the Tables product.

I’ve created a Form for my course issue tracker Table.

And now that Google Tables has officially launched, I can include this Form in my online school so students are able to submit tickets directly.

Google Tables Form

FAQ About How To Use Google Tables

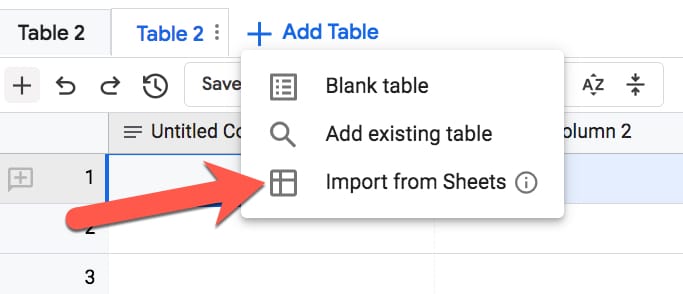
Can I turn my existing Google Sheets into Tables?

Yes! When creating new Tables, you can import data directly from existing Google Sheets.

Tables Import From Sheets

How is Tables different from Google Sheets?

The simplest way I can describe it is that Google Sheets is for your data and Google Tables is for your information.

Google Sheets does calculations, summarizes large datasets and creates charts and dashboards. Tables doesn’t do any of those things.

Instead, Google Tables makes it easy to store and organize information, and automate actions. Tables lets you quickly create workflow documents that are easier to use than spreadsheet equivalents.

Should I move to Google Tables from Trello or Airtable?

The Kanban board layout within Tables is similar to how Trello operates. The bots in Tables allow you to automate tasks in a similar way to Trello’s Butler tool.

Google Tables is similar to Airtable in many ways too. Like Airtable, Google Tables combines some of the best features of spreadsheets with databases, to create an ideal small business workflow and information tool.

Trello and Airtable are more mature products so they do have deeper feature sets, but Tables is new and is bound to develop quickly. Google has deprecated products in the past but I think this is a great tool with enormous potential and I hope Google Tables becomes a major player in this space.

What Else Can You Do With Google Tables?

Google Tables is designed for businesses, so anytime you’re using spreadsheets for tracking a process, ask if that’s something better suited to Tables.

The Tables team has created a huge number of templates to get you started, everything from a Product Roadmap to an Employee Directory.

I plan to share more experiences, tips, and use cases for Tables in the coming months.

I’m really excited by this product and see so many opportunities in my own business to improve my existing processes.

Resources