Build Dashboards and Kanban Boards with the Google Sheets Canvas Tool

With the new Sheets Canvas feature, we can build professional-looking interactive dashboards directly in our Google Sheets, using nothing more than natural language prompts. It’s a huge upgrade from how we used to build dashboards in Sheets.

Sheets Canvas to build a professional dashboard

Previously, we clumped together charts and used formatting tricks such as borders and background cell colors to try and recreate a professional look. It was all rather challenging and time-consuming, with limited interactive options. (Read this post to see what I mean.)

Alternatively, we might have connected Google Sheets to a third-party tool, but these incurred extra costs, introduced security risks, and were often still pretty janky.

In this post, we are going to take a look at this new Sheets Canvas feature.

Sheets Canvas Availability

At the time of writing (August 2026) the Sheets canvas feature is available only in English and to users in the Gemini Beta program for work or school accounts, or the Google AI Ultra or AI Pro personal accounts.

How To Build A Dashboard with Sheets Canvas

Firstly, you need to have your data ready to go in a Google Sheet, preferably in a Tables format, which is best for Gemini.

Secondly, it pays to think about your dashboard before launching into building it.

That way, you won’t end up building something that isn’t useful. Instead, you plan what information will be shown on the dashboard and how it will work, which will result in a more successful outcome.

For example, ask yourself these questions:

  • What are the key metrics to show?
  • Who is the intended audience for this dashboard?
  • How technically literate are they? Will they understand how to read complex charts?
  • How familiar are they with this data and its background context?

With your data and design plan to hand, you’re ready to start creating a Sheets Canvas.

There are three entry points:

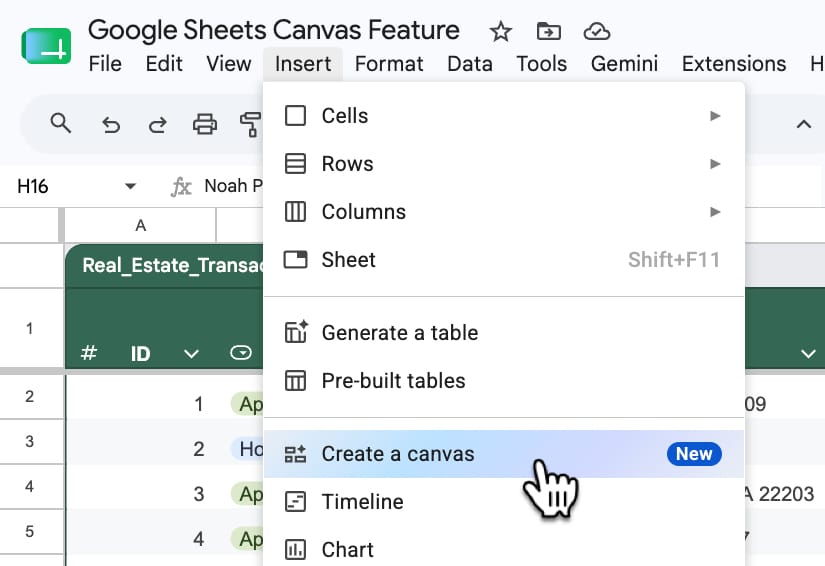
  1. From the toolbar: Insert > Canvas
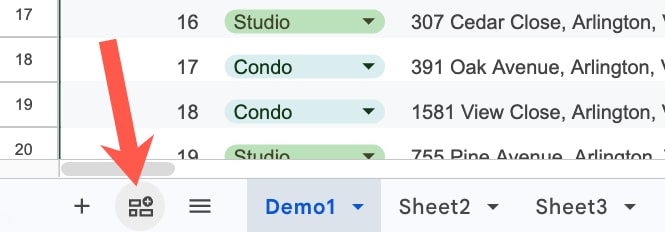
  2. Using the “Create a canvas” button in the bottom left of your Sheet, next to the Sheet names.
    (Both 1 and 2 open the Gemini sidebar with the Canvas option pre-selected.)
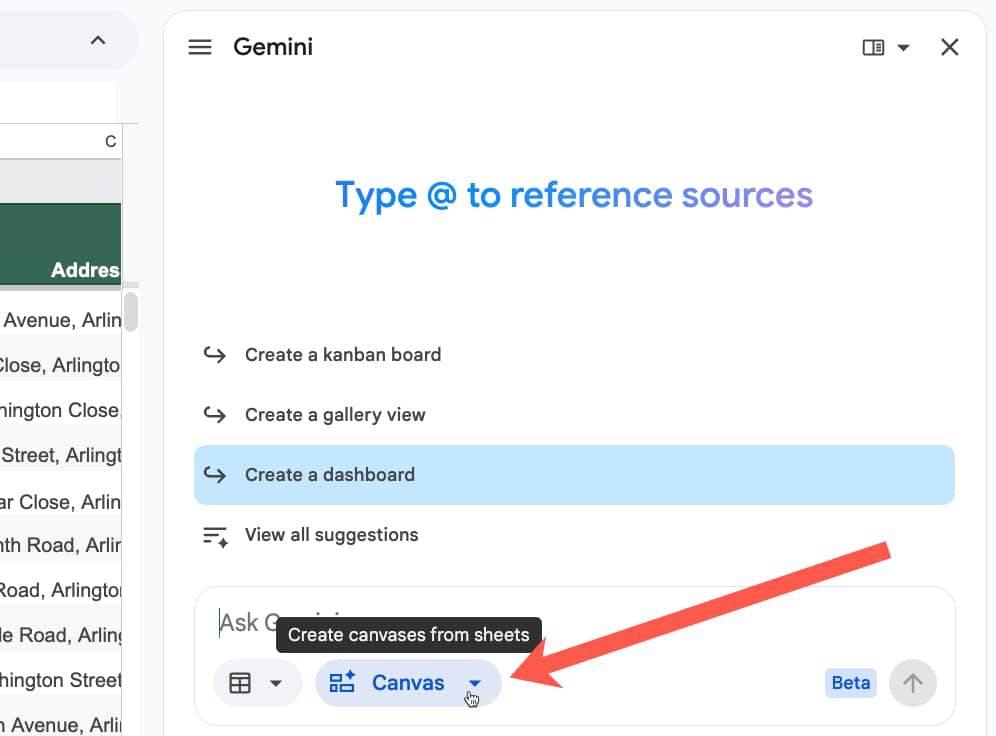
  3. You can select “Create canvas” directly in the Gemini sidebar too.

1. Insert menu:

Toolbar menu to insert a Sheets Canvas

2. Create a canvas button:

Insert button for Canvas feature in Google Sheets

3. Create canvas in Gemini Sidebar:

Canvas feature in Gemini sidebar of Google Sheet

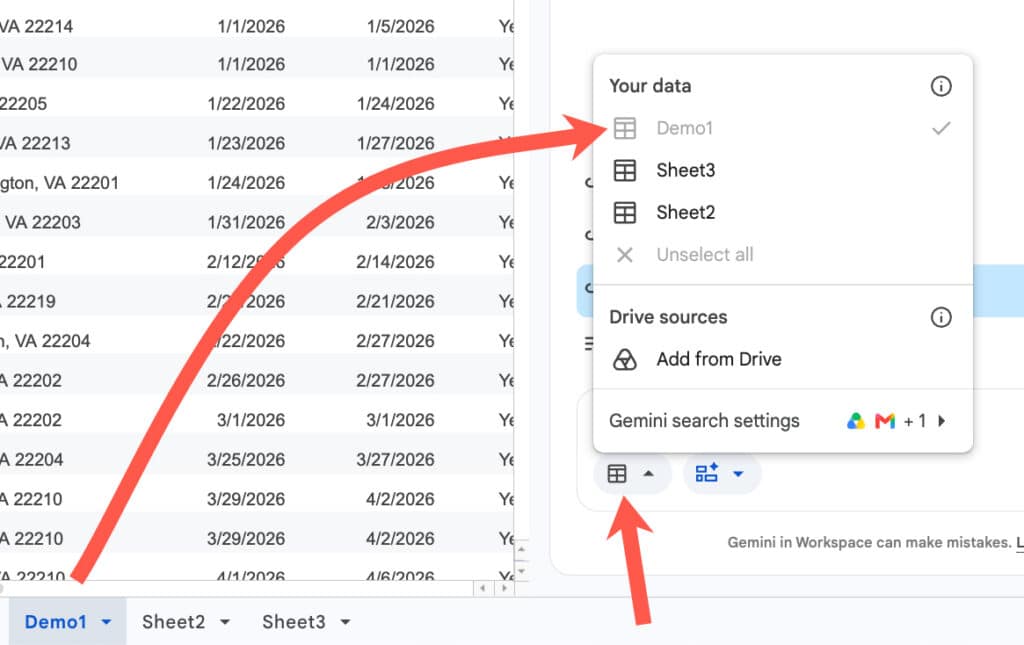
With Gemini sidebar open and the canvas feature selected, make sure you select the correct dataset(s) for the dashboard.

Use the button next to the Canvas option and choose the sheet containing your data. If you already have that sheet open, then it will automatically be selected, and you can deselect the other sheets if you don’t need them.

Select data in Sheets Canvas

Now you’re ready to insert your prompt.

Example 1: Real Estate Dashboard

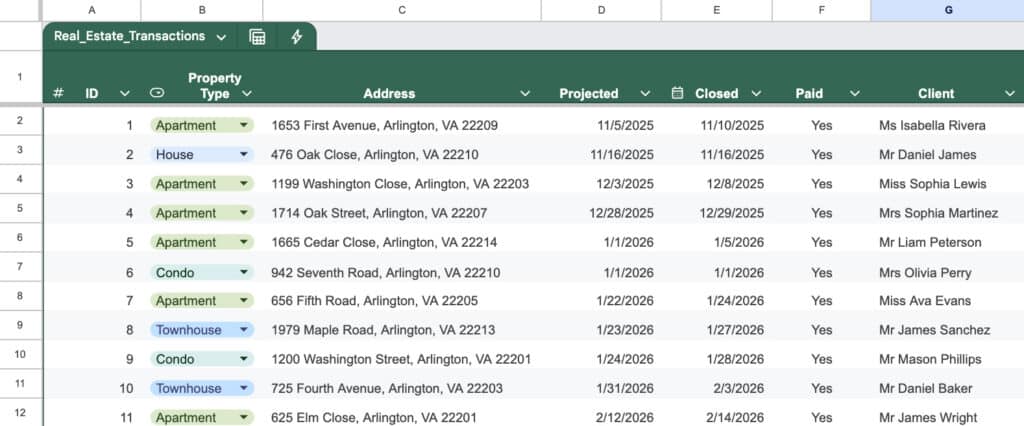
Consider this dataset of real estate transactions:

Real Estate data in Google Sheets

Here’s an example prompt to build a dashboard for this data:

Build a comprehensive real estate transaction dashboard to track performance, commissions, and lead generation. Include the following elements:

1. Key Performance Indicators (KPIs): Calculate the total sum of Sales Price, Commission Income, Agent Commission, and Net Profit for Tax for all “Closed” and “Paid” deals.

2. Agent Performance: Create a summary table or chart showing the total Commission Income and Net Profit generated by each Agent.

3. Lead Source Analysis: Create a bar chart breaking down total Sales Price and total number of transactions by Lead Source to see which marketing channels are most effective.

4. Buyer vs. Seller Split: Create a visual breakdown comparing the number of transactions and total Commission Income based on the Deal Side (Buyer vs. Seller).

5. Deal Pipeline: Provide a quick count of transactions categorized by Deal Status to show how many deals are currently pending versus closed.

Please format this with a clean, professional layout, using bold headers for each section and placing the charts logically next to the summary tables. 

Use hex color #0F9E59 as the primary color and #9E0F9C as the secondary color.

Pro Tip: Save your best dashboard prompts in a prompt library for future reuse.

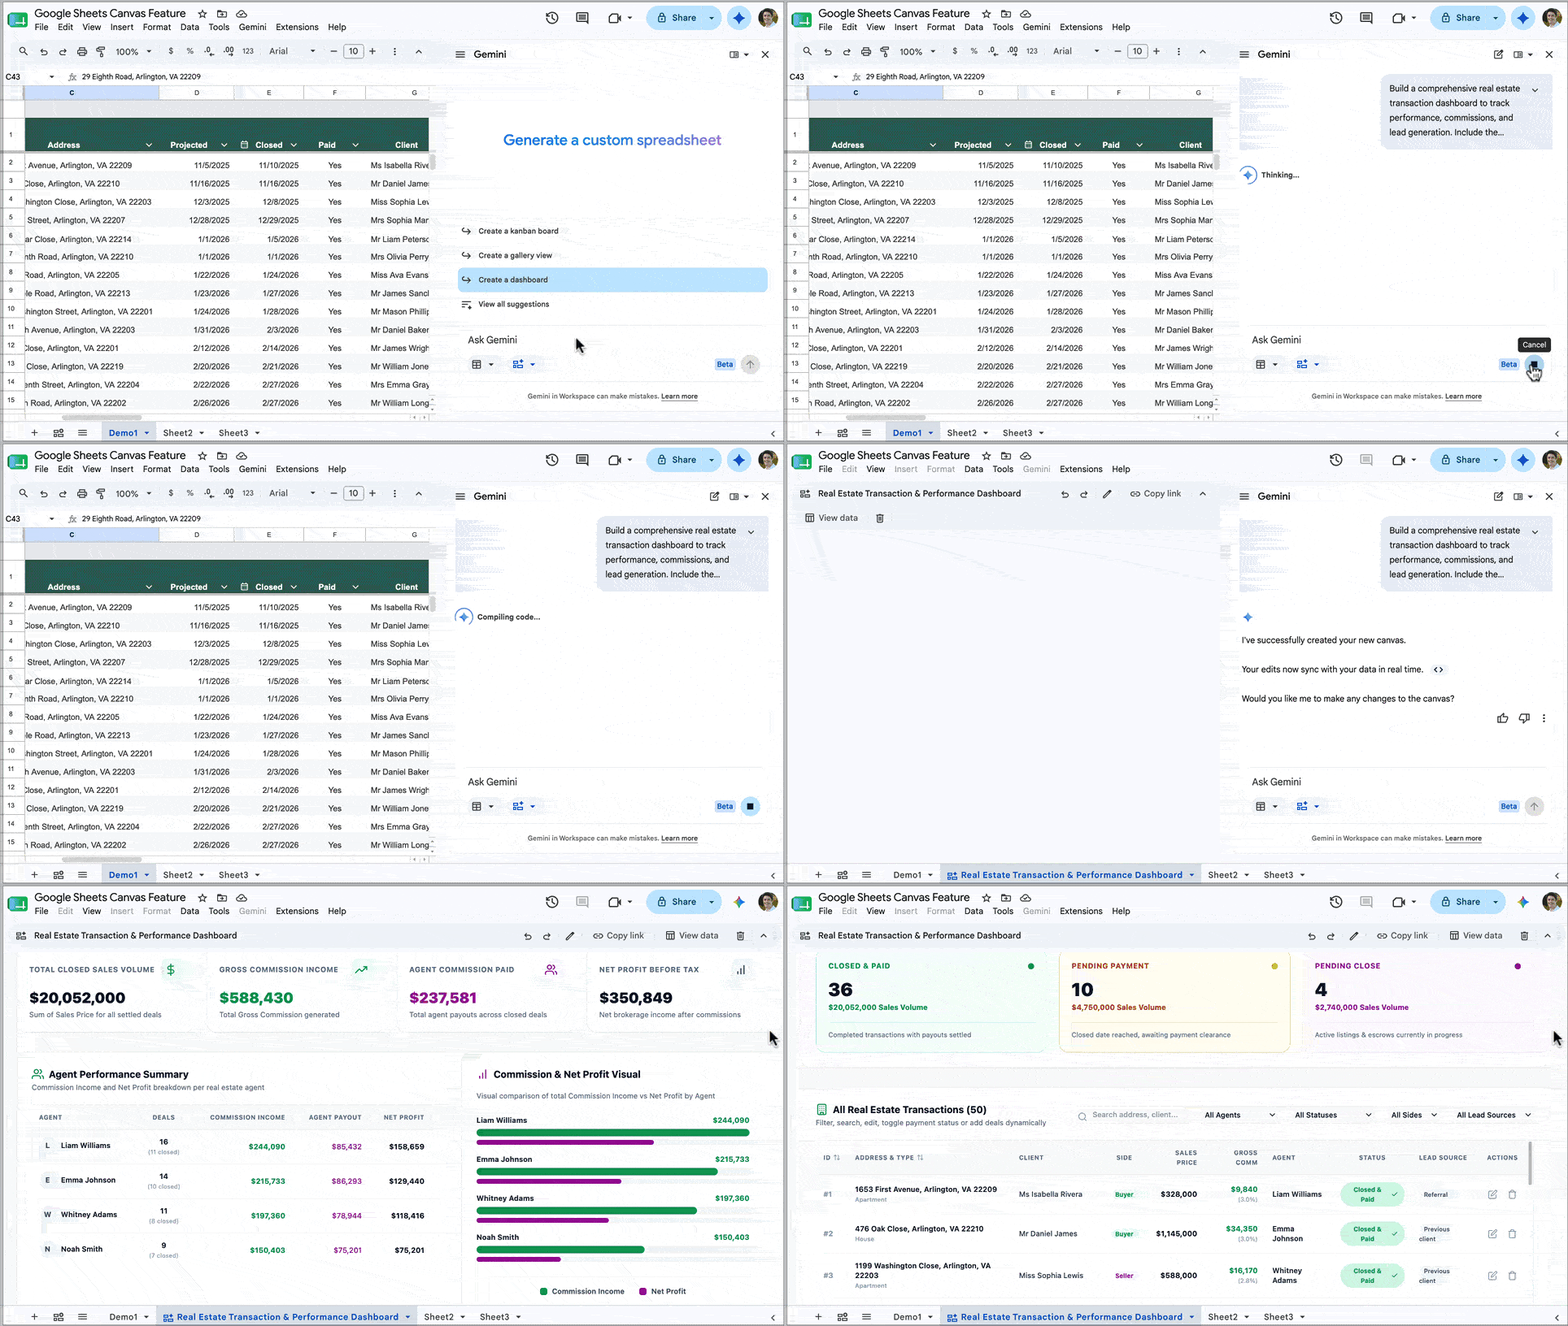
Typically, Gemini takes a few minutes to build the dashboard, depending on how complex your prompt is.

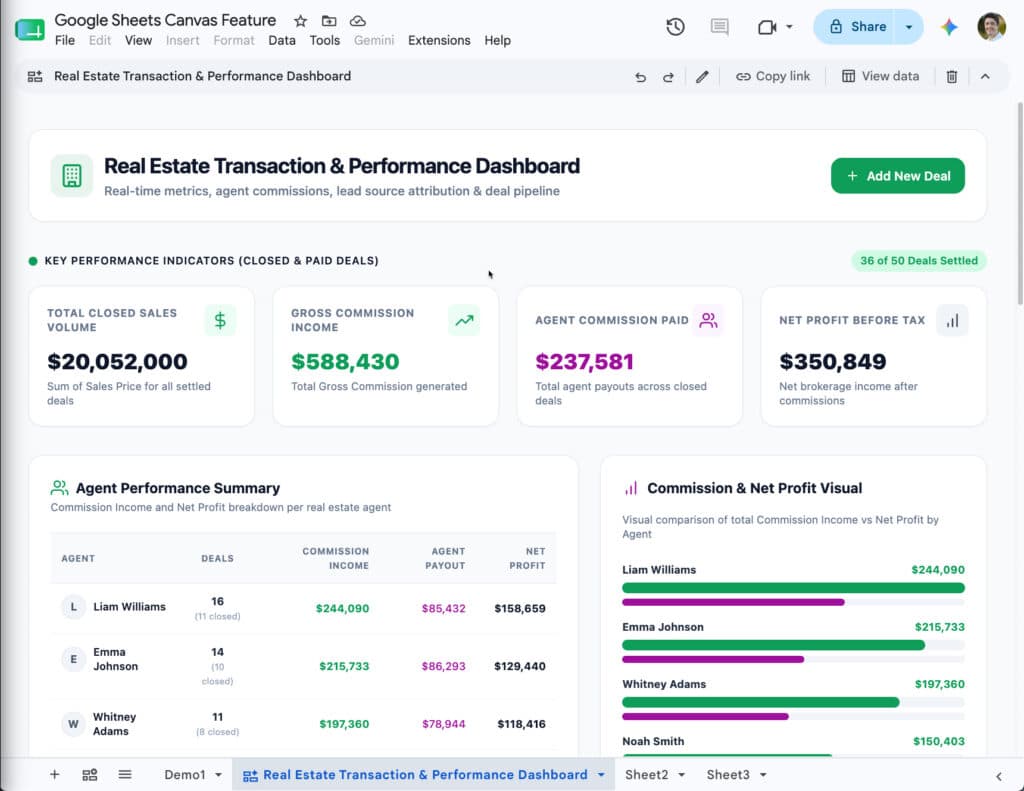
The output for the real estate data example looks like this:

A real estate dashboard built using Google Sheets Canvas

Notice how the colors match the colors mentioned in the prompt (#0F9E59 as the primary color and #9E0F9C as the secondary color).

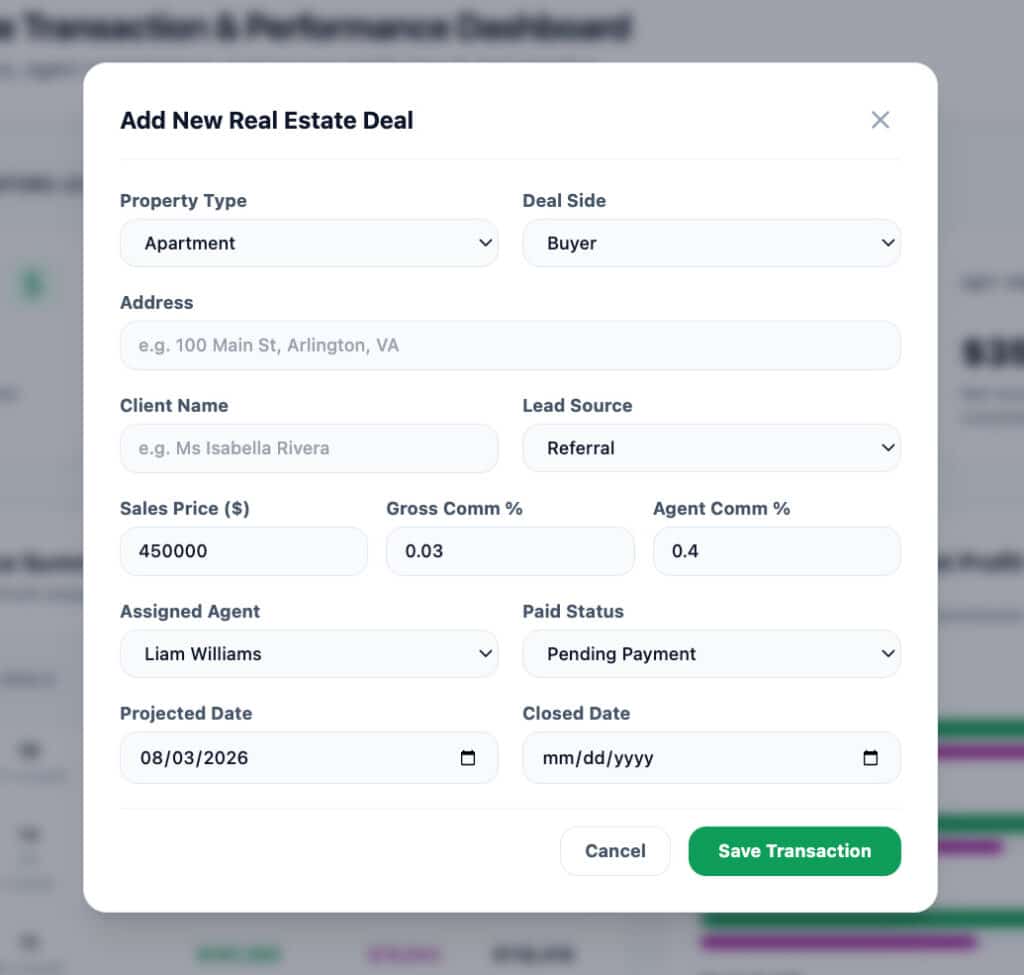
Also, notice the “Add New Deal” button in the top right corner. When you click this, it opens a pop-up with a form to add new deals:

Add new data button in Sheets Canvas

This data is inserted directly into your original data table in Google Sheets. It’s a great way for users to add new data without leaving the dashboard view, and it saves users from needing to navigate the data in the spreadsheet itself.

At the the top of the canvas is a small edit bar for making changes, sharing, or deleting the canvas:

To use the “Copy link” button to share the canvas, you need to first grant file access (through the regular “Share” button in the top right of your Google Sheet) to anyone you want to share the canvas with.

Example 2: Kanban Board

The Sheets canvas tool is not limited to regular dashboards, though.

It can also build interactive Kanban boards, which is my favorite use case and a killer feature.

Build a Kanban board in Google Sheets with the Canvas feature.

Kanban boards are visual project management tools that organize tasks into columns and allow you to drag and drop cards between these columns.

Previously, this sort of interactivity was impossible inside of Google Sheets, but now with this new Sheets Canvas feature, you can build a fully featured Kanban board with a single prompt.

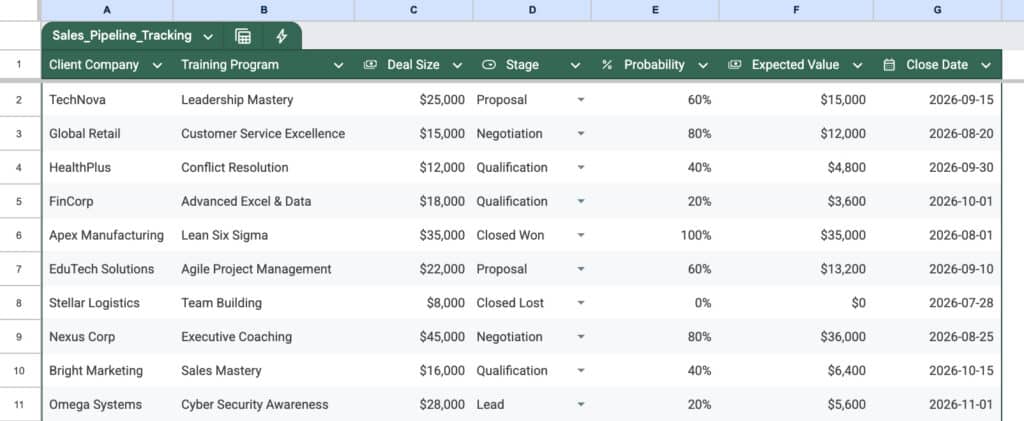
For example, here is a client pipeline data set for training contracts:

Sales Data Pipeline in Google Sheets

And here’s an example prompt to generate a Kanban board from this data:

Please generate a Kanban board layout with the following specifications:

1. Structure: Group the data using the “Stage” column.

2. Card Details: Under each Stage header, create individual “cards” or grouped cells for each transaction. Each card should display the most critical information at a glance:

  • Company & Client Name
  • Deal Size & Expected Value

3. Formatting:

  • Please apply conditional formatting or color-coding to the cards based on the “Probability” column (e.g., green for high probability, yellow for medium, red/gray for low) so I can easily identify which deals are most likely to close.
  • Ensure the layout is clean and minimalist.

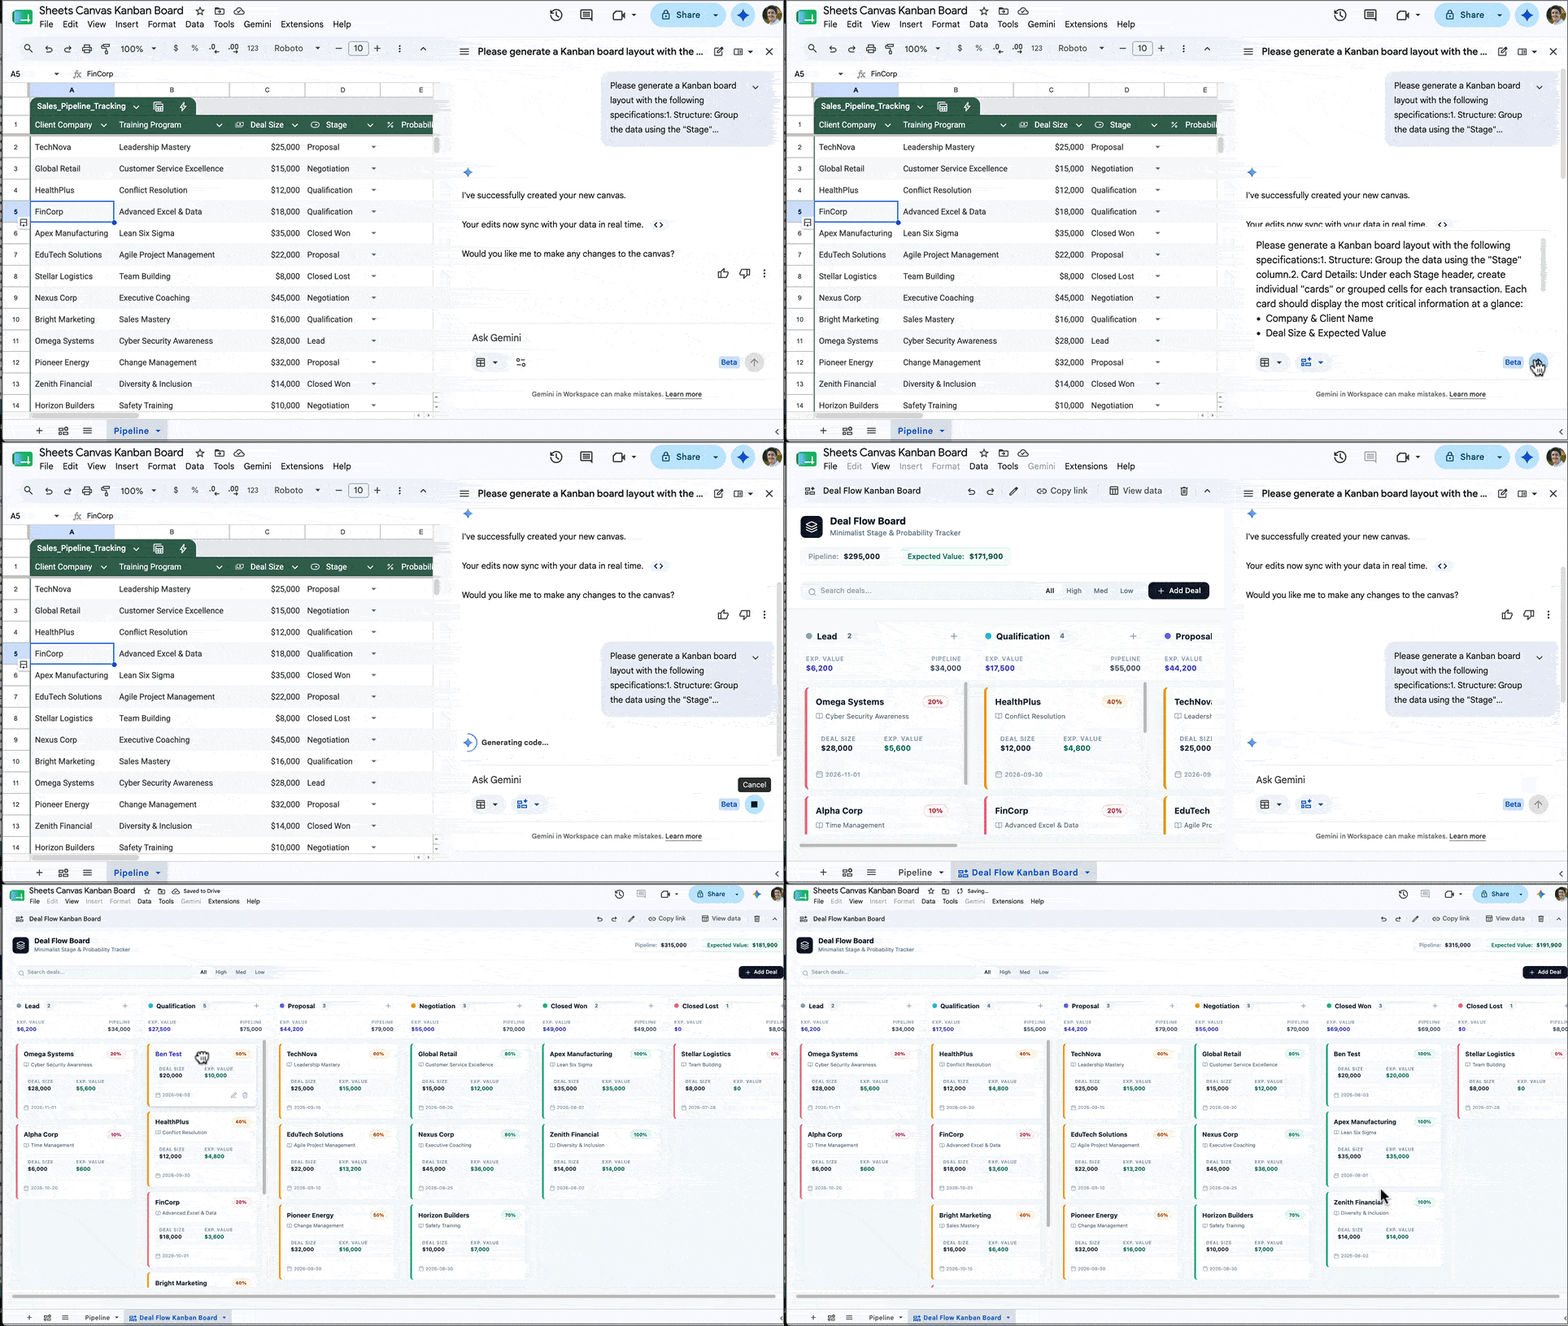
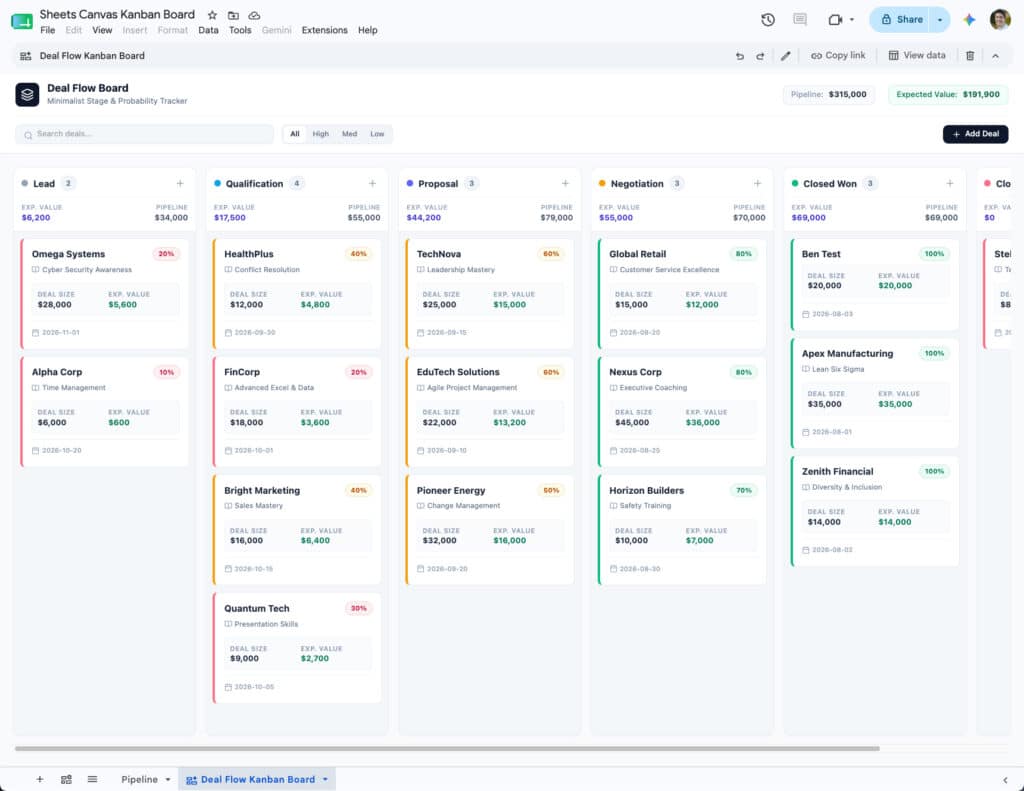
The output from this prompt looks something like this:

Kanban Board in Sheets Canvas

You can then drag these cards into different columns as needed to show progress. When you drag a card into a new column, the data in the underlying sheet also updates to reflect that, so they are always synced in real time.

And as with the dashboard from earlier, there is also a button to add new data from the Kanban canvas rather than having to go back to the actual spreadsheet data.

Limitations

At the moment, if you want to modify the dashboard generated by the Sheets Canvas tool, you give it an additional prompt in the Gemini sidebar. For example, you might prompt Gemini with “change the leads pie chart into a bar chart“.

Unfortunately, when Gemini updates the dashboard, other elements might inadvertently change too.

I think the real breakthrough will come when we can click on individual features within the Dashboard or Kanban board and give specific instructions to modify that specific feature only with a prompt. Hopefully that is something coming down the line.

Conclusion

This new Sheets Canvas feature is a fantastic tool that dramatically expands the possibilities of what you can do with data in Google Sheets.

And, whilst the regular chart tool will remain extremely useful for specific analysis and one-off charts, the old way of building dashboards is rapidly becoming obsolete.

I can’t imagine spending hours manually positioning charts, hand-picking background cell colors and borders, and all manner of other dark arts, to build a dashboard the old way, knowing it wouldn’t even look half as good as what this new canvas tool can build in a few minutes.

If you have access to this canvas tool, then I encourage you to experiment with it to build your dashboards.

Google Sheets and Workspace Updates from Google Next 2026

Unfortunately, I missed the Google Next conference this year. 

It looked like a great event with loads of exciting announcements, including significant ones for Google Workspace. The big shift in 2026 is the evolution from AI assistance (Gemini helping you) to Agent workflows (Gemini doing things for you).

Here’s a list of the most interesting for us Sheets/Workspace developers, but let me know if you think I missed anything!

Across Google Workspace

  • Google Workspace Intelligence: making Gemini assistant smarter by letting it tap into your organization’s actual work context, not just the open internet. It looks at your work content and patterns and reasons over that.
  • Universal Search: Agents can search across all Workspace Apps to get a consolidated view of the user’s context across all apps.
  • Official Workspace CLI (Command Line Interface) to call Workspace APIs from command line.
  • Dedicated Workspace MCP Server: For Gmail, Drive, Calendar, Chat, People.
  • Agent Control Centre in Google Workspace Admin Console to help you monitor, control, and audit agent access to your data in Workspace.

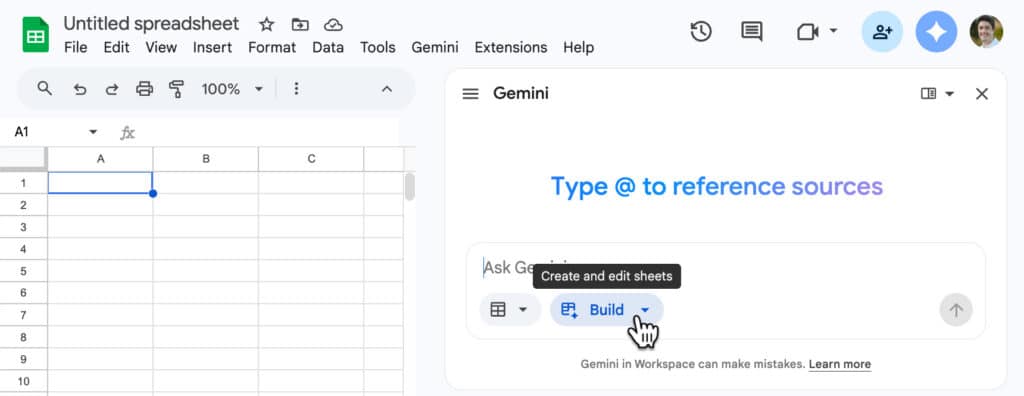
Gemini in Sheets

The new “Build” feature in Google Sheets.

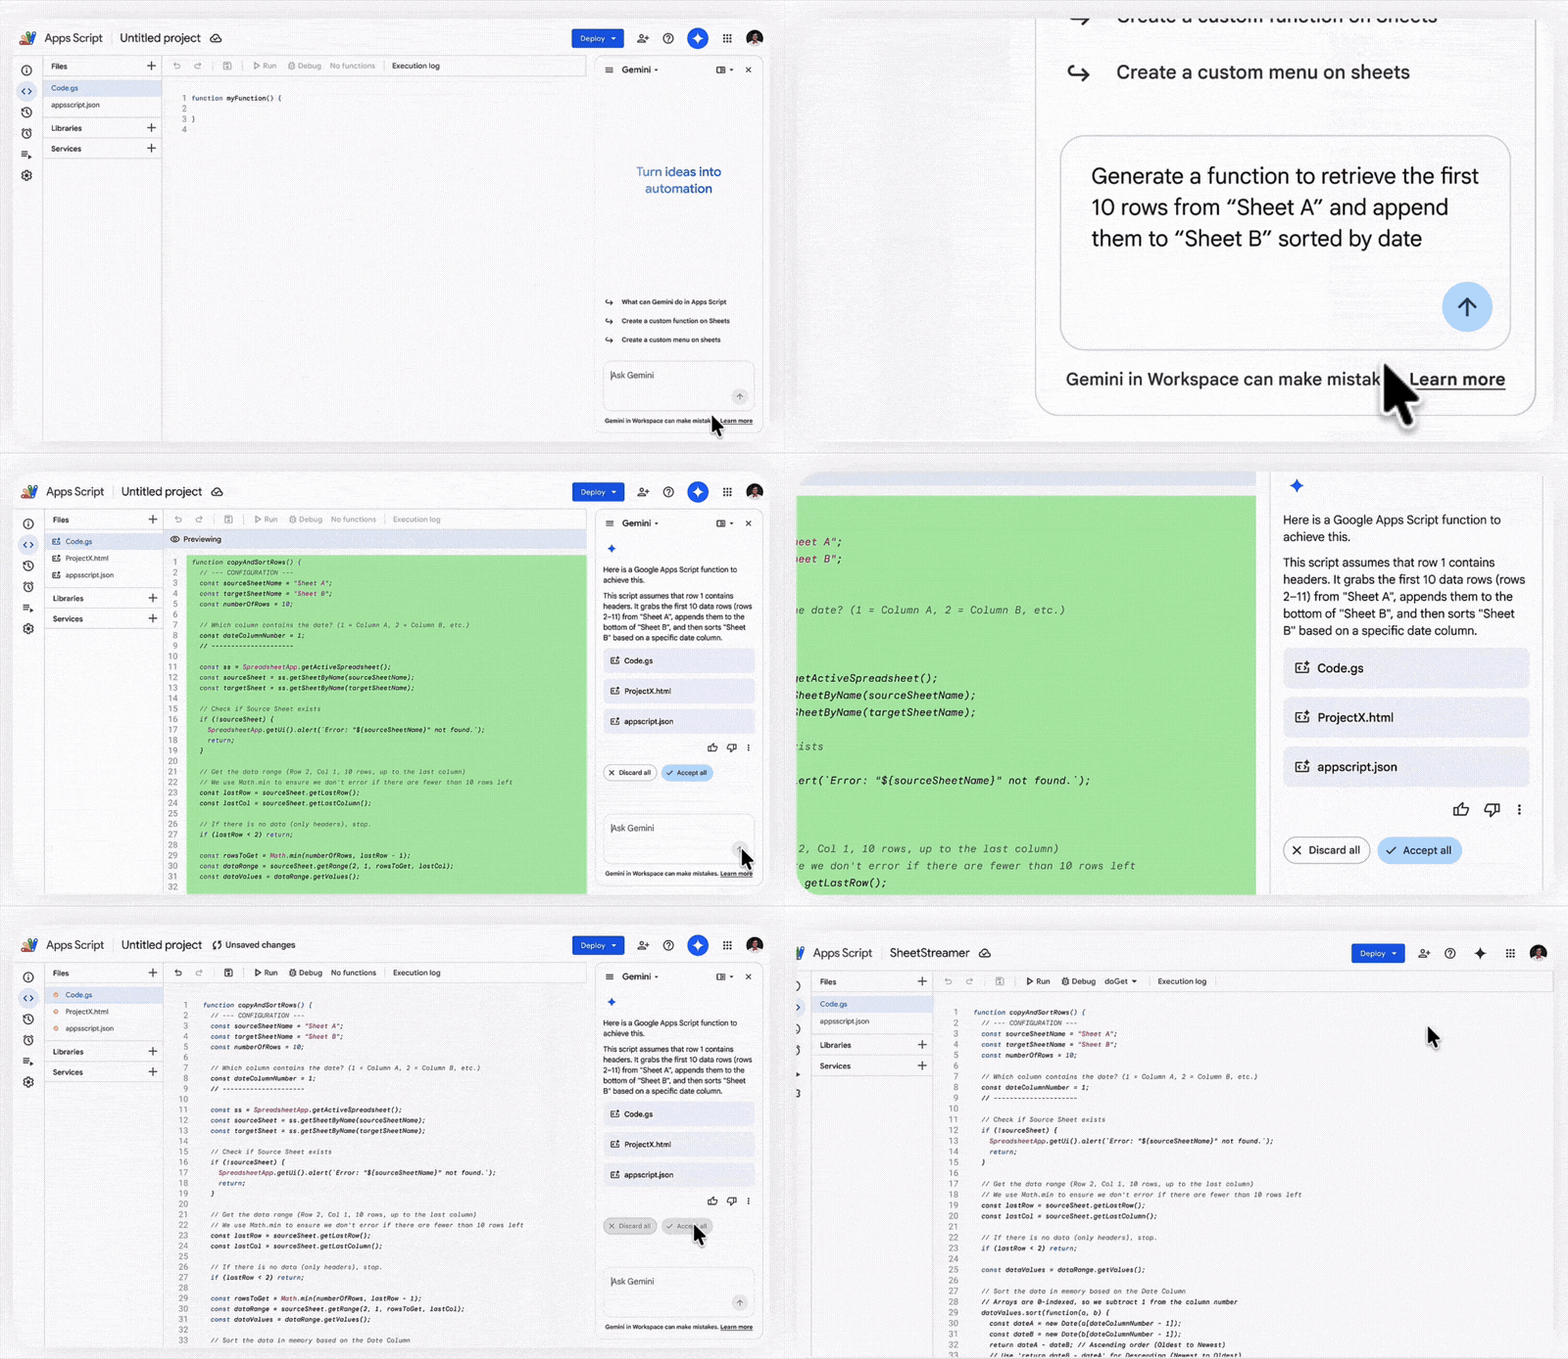
Google Apps Script

Gemini sidebar in Apps Script editor (coming soon).

Workspace Studio

Workspace Studio is the new visual, drag-and-drop tool that lets users build workflow agents using natural language. New features coming:

  • Skills feature (see announcement #2): To deploy agentic automation across every team.
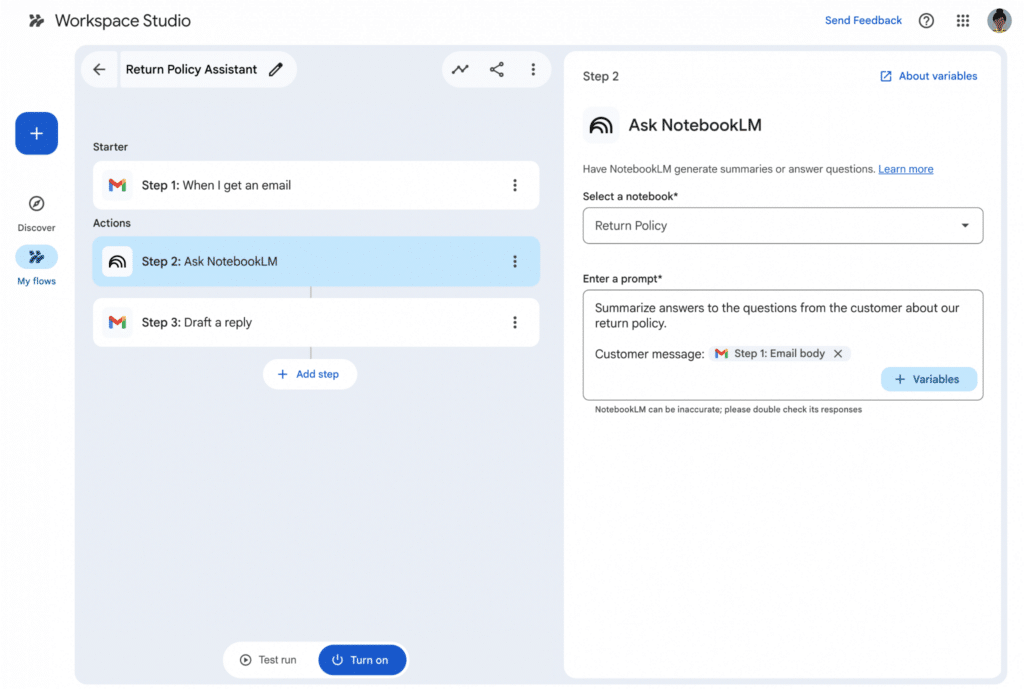
  • NotebookLM Integration: Integrate notebooks from NotebookLM directly into Google Workspace Studio automation workflows to use existing documents as a grounded knowledge source.
  • Third-Party Connectors: Out-of-the-box integration for agents to pull data from Asana, Jira, Mailchimp, and Salesforce directly into Workspace.
  • Gems Integration: An “Ask a Gem” step that allows flows to send prompts to private Gems to automate summaries or document creation.
NotebookLM integration with Workspace Studio.

Further Reading

Here’s Google’s official video summarizing the key Workspace announcements:

And here’s the full list of all 260 product announcements from Google Next 2026:

260 things we announced at Google Cloud Next ’26 – a recap

Custom Number Format Color Palette Reference Table

Reference table for custom number format color palette.

Also available as a Google Sheet.

Code Name Example Color Hex Red Green Blue
[color1] black 1   #000000 0 0 0
[color2] white 2   #FFFFFF 255 255 255
[color3] red 3   #FF0000 255 0 0
[color4] green 4   #00FF00 0 255 0
[color5] blue 5   #0000FF 0 0 255
[color6] yellow 6   #FFFF00 255 255 0
[color7] magenta 7   #FF00FF 255 0 255
[color8] cyan 8   #00FFFF 0 255 255
[color9] [color9] 9   #800000 128 0 0
[color10] [color10] 10   #008000 0 128 0
[color11] [color11] 11   #000080 0 0 128
[color12] [color12] 12   #808000 128 128 0
[color13] [color13] 13   #800080 128 0 128
[color14] [color14] 14   #008080 0 128 128
[color15] [color15] 15   #C0C0C0 192 192 192
[color16] [color16] 16   #808080 128 128 128
[color17] [color17] 17   #9999FF 153 153 255
[color18] [color18] 18   #993366 153 51 102
[color19] [color19] 19   #FFFFCC 255 255 204
[color20] [color20] 20   #CCFFFF 204 255 255
[color21] [color21] 21   #660066 102 0 102
[color22] [color22] 22   #FF8080 255 128 128
[color23] [color23] 23   #0066CC 0 102 204
[color24] [color24] 24   #CCCCFF 204 204 255
[color25] [color25] 25   #000080 0 0 128
[color26] [color26] 26   #FF00FF 255 0 255
[color27] [color27] 27   #FFFF00 255 255 0
[color28] [color28] 28   #00FFFF 0 255 255
[color29] [color29] 29   #800080 128 0 128
[color30] [color30] 30   #800000 128 0 0
[color31] [color31] 31   #008080 0 128 128
[color32] [color32] 32   #0000FF 0 0 255
[color33] [color33] 33   #00CCFF 0 204 255
[color34] [color34] 34   #CCFFFF 204 255 255
[color35] [color35] 35   #CCFFCC 204 255 204
[color36] [color36] 36   #FFFF99 255 255 153
[color37] [color37] 37   #99CCFF 153 204 255
[color38] [color38] 38   #FF99CC 255 153 204
[color39] [color39] 39   #CC99FF 204 153 255
[color40] [color40] 40   #FFCC99 255 204 153
[color41] [color41] 41   #3366FF 51 102 255
[color42] [color42] 42   #33CCCC 51 204 204
[color43] [color43] 43   #99CC00 153 204 0
[color44] [color44] 44   #FFCC00 255 204 0
[color45] [color45] 45   #FF9900 255 153 0
[color46] [color46] 46   #FF6600 255 102 0
[color47] [color47] 47   #666699 102 102 153
[color48] [color48] 48   #969696 150 150 150
[color49] [color49] 49   #003366 0 51 102
[color50] [color50] 50   #339966 51 153 102
[color51] [color51] 51   #003300 0 51 0
[color52] [color52] 52   #333300 51 51 0
[color53] [color53] 53   #993300 153 51 0
[color54] [color54] 54   #993366 153 51 102
[color55] [color55] 55   #333399 51 51 153
[color56] [color56] 56   #333333 51 51 51

An extremely detailed look into the origins of this color palette from its early Excel days can be found here.

Status Arrows in Google Sheets

Status arrows are little up or down symbols added to data that make it quick and easy to understand what’s happening. They’re a useful way to highlight changes in your data.

Consider the following sales data which has a % change column:

Google Sheets percent table

Now take a look at the same data with colors and arrows added to call out the % change column:

Google Sheets table

It’s significantly easier/quicker to read and absorb that information.

How to Add Status Arrows

Hidden in the Custom Number Format of Google Sheets is a conditional formatting option for setting different formats for numbers greater than 0, equal to 0, or less than zero. This can be used to show the up or down status arrows.

Step 1. Highlight the % column and go to the custom number formatting menu:

Google Sheets custom number format menu

Step 2. Copy and paste this custom number format rule into the Custom number formats popup:

[color50]0% ▲;[color3]-0% ▼;[blue]0% ▬

Google Sheets custom number format

What you’re doing is specifying a number format for positive numbers first, then negative numbers and then zero values, each separated by a semi-colon.

The square brackets to specify the color you want e.g. [color50] for green. See the full list of colors here: Custom Number Format Color Palette Reference Table

The cells in the data are still numbers even though the status arrows are showing. The arrows are a visual layer on top of the number.

How to use the AI Function in Google Sheets (with 10 examples)

The AI Function in Google Sheets brings the power of Gemini AI directly into your cells.

It uses Gemini’s large language models (LLMs) to process the text prompts and return helpful responses. It’s akin to using a prompt in the chat window of Gemini, but with the convenience of being accessible in your Sheet.

And it’s as easy to use as any other formula!

Who has access to the AI Function?

The AI Function is available to people on the following Google Workspace plans:

  • Business Standard and Plus
  • Enterprise Standard and Plus
  • Customers with the Gemini Education or Gemini Education Premium add-on
  • Google AI Pro and Ultra

Anyone who previously purchased these legacy add-ons will also have access to the AI function:

  • Gemini Business
  • Gemini Enterprise

Additionally, it’s available to users enrolled in the Google Workspace Labs program.

☠️ Note: If you don’t have access to the function, you can achieve any of these results by copy-pasting data into Gemini (or ChatGPT or Claude) and running the prompt there. And then you can paste the results back into your Sheet. Obviously, it’s not as convenient!

How to use the AI Function

The AI function is simple to use and has the following form:

=AI( "prompt" , [optional range] )

It takes two arguments:

  1. the prompt, which is a description of the action you want the function to perform, enclosed in double quotes, and
  2. an optional range, which is a reference to a single cell or range containing information that provides extra context to the AI function.

The AI function is most useful for working with text. There are four broad actions that it can perform:

  • Sentiment analysis
  • Summarizing text
  • Categorizing text
  • Generating text

Example 1: Sentiment Analysis with the AI Function

AI function to perform sentiment analysis in Google Sheets

Suppose you manage an AirBnb and you have a Google Sheet containing reviews. You can use the AI function to analyze the sentiment of these reviews to identify positive and negative reviews.

Use this prompt:

Categorize sentiment as positive, negative, or neutral

inside the AI function as follows:

=AI( "Categorize sentiment as positive, negative, or neutral" , D6 )

where the cell D6 contains the review.

Alternatively, we can include the reference to cell D6 directly in the prompt argument by concatenation:

=AI( "Categorize sentiment of the review in " & D6 & "as positive, negative, or neutral" )

In this case, we don’t specify the option range argument.

Perhaps the only benefit of this second approach is that it lets you reference non-contiguous ranges, i.e. multiple cells in different parts of your Sheet.

For example, this text generation AI formula references cells in column B and D (i.e. non-adjacent), which wouldn’t be possible with a single range argument:

Using cell references inside the AI function

But if you are using a single cell or range, it’s easier to include it as the second argument of the AI function.

Example 2: Sentiment Analysis as a Rating Chip

An alternative way to show sentiment analysis is to ask the AI function to output a rating between 1 and 5 and then format the cells as Rating chips.

Rating chips based on AI formula

The AI formula is:

=AI( "Rate the feedback in this review between 1 and 5, with 1 being the worst score and 5 being the best score" , D6 )

This gives an output between 1 and 5 (technically, 0 to 5 would also work).

Then highlight the cells with the rating numbers and change them to Rating chips via the menu:

Insert > Smart chips > Rating

Alternatively, if your data is in a Table, you can change the column type to a Rating chip under the column menu:

Edit column type > Smart chips > Rating

Example 3: Summarize Text

Summarize text with the AI Function

With the review text in cell D6, we can use this formula to summarize the text:

=AI( "write a summary of the user's feedback in under 10 words" , D6 )

Example 4: Categorize Text

Categorize text with the AI Function

Suppose we have a list of products that we need to categorize into groups. It’s a hugely time consuming task.

The AI function can dramatically speed that process up.

With the data in column B, we can use a formula like this to categorize the products:

=AI( "categorize the product into one of these consumer electronics categories: Audio,Home Entertainment,Mobile Device,Wearable,Home Appliance,Gaming,Smart Home,Computing,Photography,Kitchen Appliance,Drones,Mobile Accessory" , B7 )

Example 5: Generate Text

Generate marketing copy in Google Sheets with AI formulas

In this example, we use the AI formula to generate marketing copy for products on Instagram. We tell Gemini to add emojis and hashtags in the output.

Note also that because the product name is in column B and the key features are in column D, we need to insert the references into the prompt:

=AI( "Generate a short less than 20-word description for instagram for this product " & B6 & " with these features " & D6 & ". Make it funny, and include emojis and add relevant hashtags" )

This just inserts the value from cells B6 and D6 into the text string prompt before the AI formula runs it.

Example 6: Generate Email Drafts

Generate email drafts with AI functions

We use a longer, ultra-specific prompt to ensure the emails are formatted exactly as we want them.

And the formula references data in the range B6 to G6 (i.e. the whole Table row) for context:

=AI( "Write a professional email to the parent or guardian of this student, summarizing their academic performance and classroom behavior.
The email should be written from me, Ben Collins. I am their teacher.
Start each email with a subject line formatted exactly as:
Subject: Name of Student’s Progress Repor
For example: Subject: John Smith’s Progress Report.
The tone should be warm, supportive, and informative—highlight both strengths and areas for improvement.
Avoid overly technical language, and keep the email clear and easy to understand.",B6:G6)

​This is part of a YouTube tutorial on turning Google Sheets data into Gmail drafts, with the AI Function and Apps Script.

Example 7: Explaining Formulas

At the time of writing (August 2025), the AI function cannot be nested inside other functions, or vice versa.

To combine it with other functions, we have to create helper columns that output intermediate steps.

So before we can explain that complex formula in cell A1, we have to use the FORMULATEXT function to turn it into text:

Formulatext function in Google Sheets

The formula is:

=FORMULATEXT(A1)

Then we can use the AI function to explain that text version of the formula:

Explain formulas with the AI function in Google Sheets

The AI formula is:

=AI("explain what this formula does and how it works",C1)

Example 8: Categorize Stock Tickers

We can use the AI function to categorize stock tickers into industry categories:

Categorize stock tickers with the AI function in Google Sheets

The formula is:

=AI("show me the sector of the stock with this ticker", stockTickers[Ticker])

where the stock tickers are in a Table called “stockTickers”.

Example 9: Parse Addresses to Extract Data

The AI function is a huge help at parsing messy addresses and extracting the component parts:

Parse addresses with the AI function in Google Sheets

The formulas for these columns are:

=AI("show me the street address only from this address",A2)
=AI("show me the town only from this address",A2)
=AI("show me the postcode only from this address",A2)

Example 10: Unpivot Data

For a final example, here it is helping to UNPIVOT data, which is turning wide data into tall data format. It’s notoriously difficult to do with regular formulas.

However, if you can handle complex formulas, the old-school, deterministic method is still more convenient since we can’t nest the AI function inside other functions yet.

But for reference, here’s how we can create an AI formula to unpivot data.

First, we unpivot data with AI:

Unpivot data with the AI function in Google Sheets

The formula is:

=AI("can you unpivot the data",A1:E4)

Then we use regular functions to parse into rows:

Unpivot data with the AI function in Google Sheets

The formula is:

=ArrayFormula(SPLIT(TRANSPOSE(SPLIT(G1,CHAR(10))),"|"))

What the AI Function CANNOT do

1) it cannot perform calculations like regular functions. If you try, you’ll get an error message:

AI Function cannot do calculations.

With all the hype around AI at the moment, it’s tempting to apply it to everything we do.

So it’s good to step back and ask yourself if you really need an AI function. Most spreadsheets tasks that involve data will still be in the domain of regular, deterministic functions, like SUM, AVERAGE, FILTER, etc.

So don’t fall into the trap of trying to apply AI to everything!

2) it cannot be nested inside other functions.

If you try to nest the AI function, for example inside an IF function as shown here, you’ll get an error message:

AI Function error

3) the AI function has limits to how much it can generate in a 24-hour window. If you hit the limit, you won’t be able to click the “Generate” button until 24 hours has passed.

4) if you select multiple cells with AI functions and click to generate outputs, only the first 200 cells will be generated. Once the first batch of 200 is complete, you can generate the next batch of 200 cells, and onwards.

5) if you access Sheets through other cloud storage providers (e.g. Dropbox, Box, etc.) then you can’t generate content with the AI function.

6) The AI function cannot generate other functions, pivot tables, or charts.

AI Function Template

Download the Complete Guide to the AI Function Template

Click on “Use Template” in the top right corner to make your own copy.

There is no Apps Script with this template.

Additional prompt examples in the Google documentation.