Play-It-Through Chess Game in a Single Google Sheets Formula

Play It Through Chess Game in Google Sheets Formula

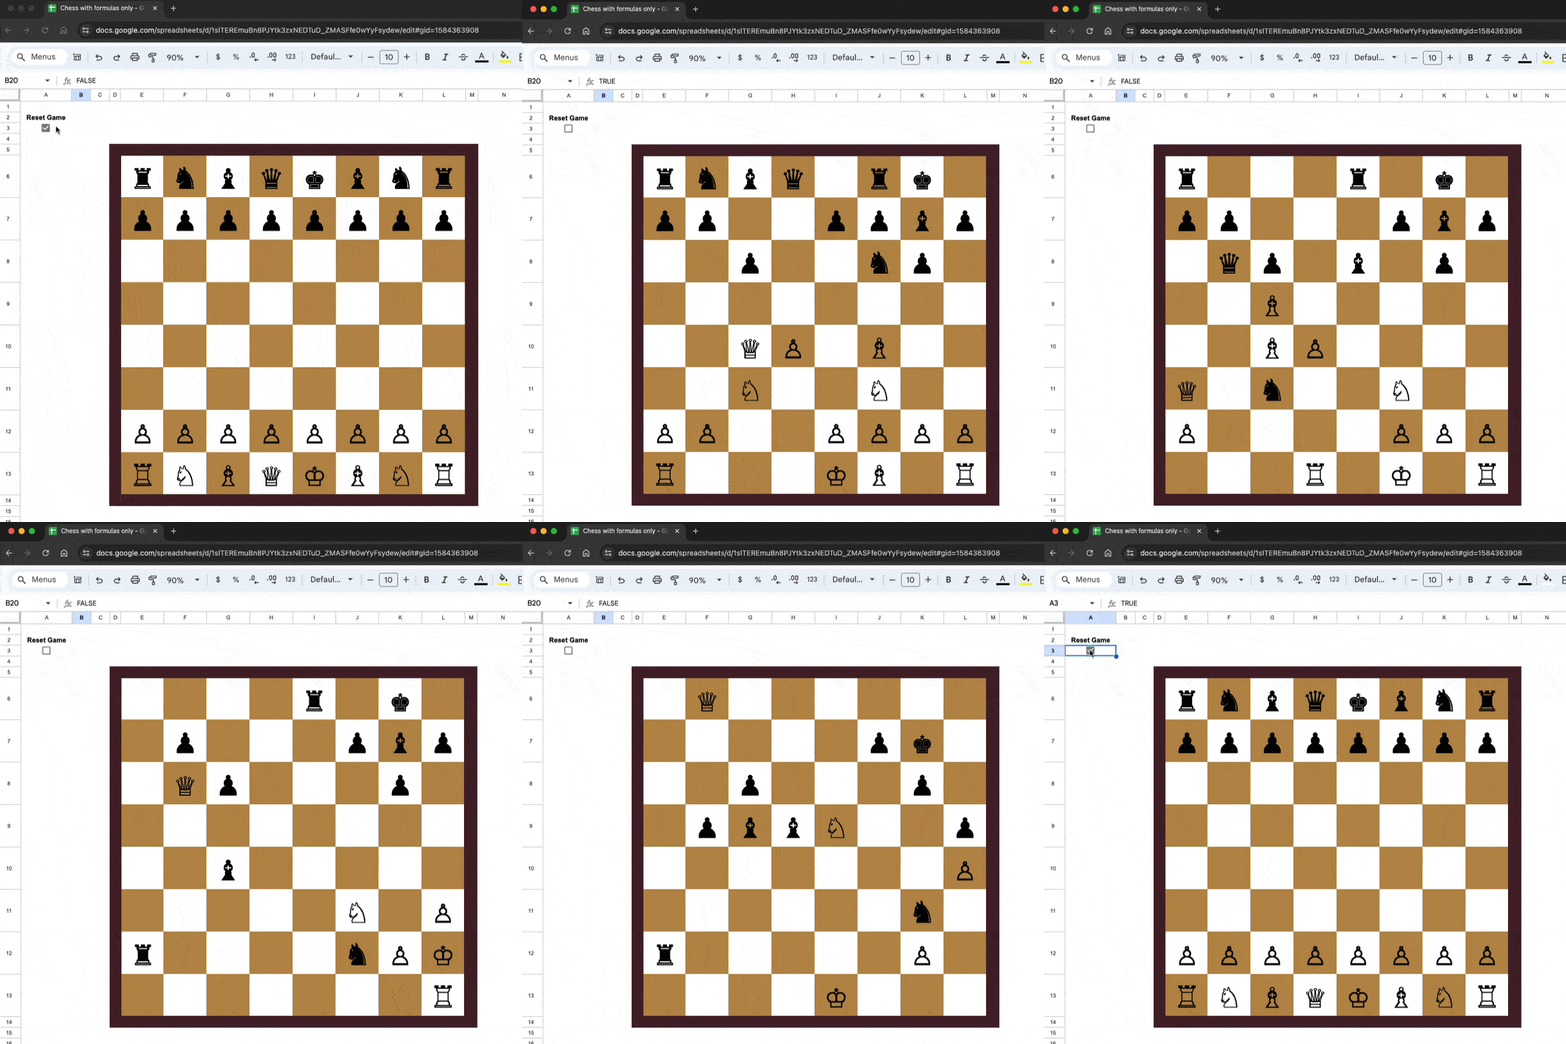
In 1956, a 13-year old Bobby Fischer announced his chess genius to the world, winning one of the finest games in chess history. In fact, Chess Review called it “The Game of the Century“.

In a game full of beauty and surprise, Fischer overcame his much older, more experienced opponent, the International Master Donald Byrne.

In this video and blog post, we create a single formula in Google Sheets that plays through this game!


Continue reading Play-It-Through Chess Game in a Single Google Sheets Formula
How To Apply Conditional Formatting Across An Entire Row In Google Sheets

Conditional formatting is a super useful technique for formatting cells in your Google Sheets based on whether they meet certain conditions.

In this post, you’ll learn how to apply conditional formatting across an entire row of data in Google Sheets.

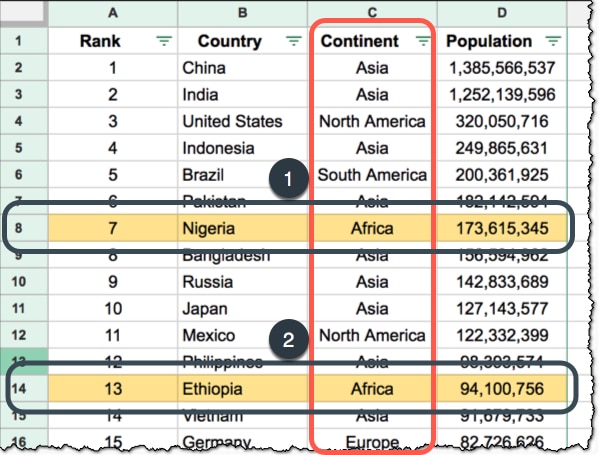
For example, if the continent is “Africa” in column C, you can apply the background formatting to the entire row (as shown by 1 and 2):

Conditional formatting across an entire row

A template with all these examples is available at the end of this post.

Continue reading How To Apply Conditional Formatting Across An Entire Row In Google Sheets

Recursion in Google Sheets With Formulas

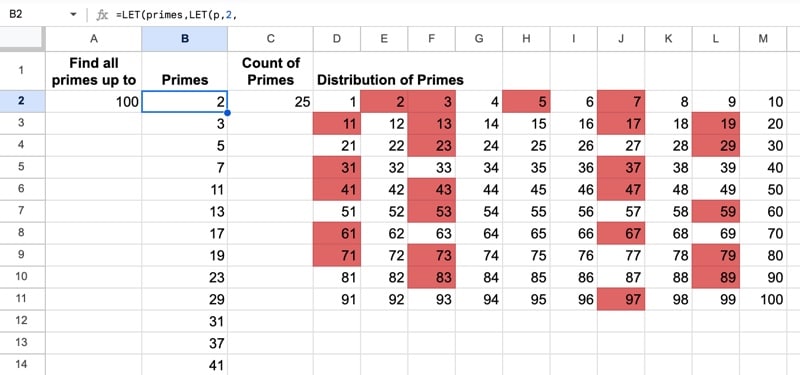
Recursion in Google Sheets is now possible with the introduction of Named functions, LAMBDA functions, and LET functions. In this post, we’ll explore the concept of recursion and look at how to implement recursion in Google Sheets.

Prime Number Distribution
Discovering prime numbers using recursion in Google Sheets
Continue reading Recursion in Google Sheets With Formulas

How To Create A Heat Map In Google Sheets

Heat maps in Google Sheets are a great way to add context to your data.

They bring attention to the high and low values in your data, to outliers that demand attention.

Best of all, heat maps in Google Sheets are easy to create.

Consider this dataset showing monthly temperatures for Washington D.C.:

Temperature Data In Google Sheets

Without any formatting, it’s boring to look at, doesn’t convey any immediate takeaways, and it’s hard to spot trends such as which years were hotter than others.

Now compare that to the same dataset with a heat map overlay (click to enlarge):

Temperature Heat Map In Google Sheets

Wow! The stories jump off the page at you now. You can easily compare the years and see which years had longer winters, or hotter summers.

Let’s see how to create a heat map in Google Sheets.

Continue reading How To Create A Heat Map In Google Sheets