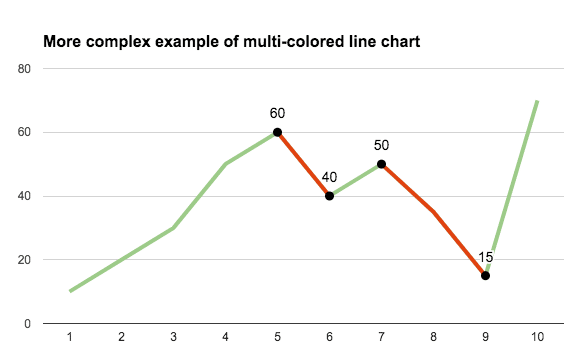
In this article, you’ll see how to create a multi-colored line chart in Google Sheets, for example when the line is increasing it’s colored green, when it’s decreasing it’s colored red, as shown in this image:
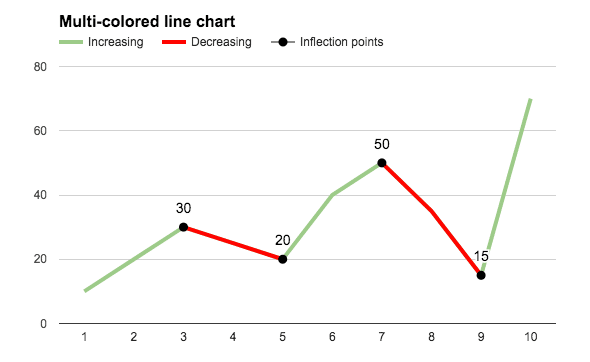
Colors are a powerful way of adding context to your charts, to bring attention to certain trends and add additional understanding.
The embedded charts tool in Google Sheets is pretty basic, so we can only achieve this with a formula workaround.
How do I create a multi-colored line chart in Google Sheets?
Basic Example
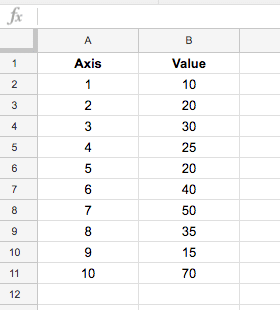
Let’s start with this basic dataset:
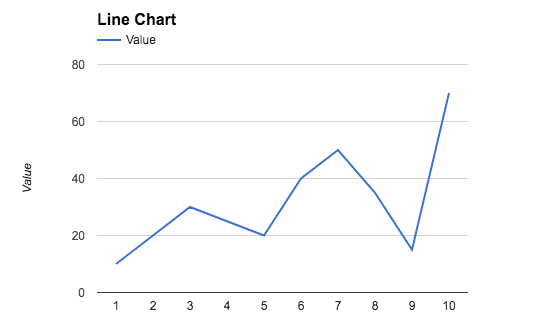
which, when charted, looks like this:
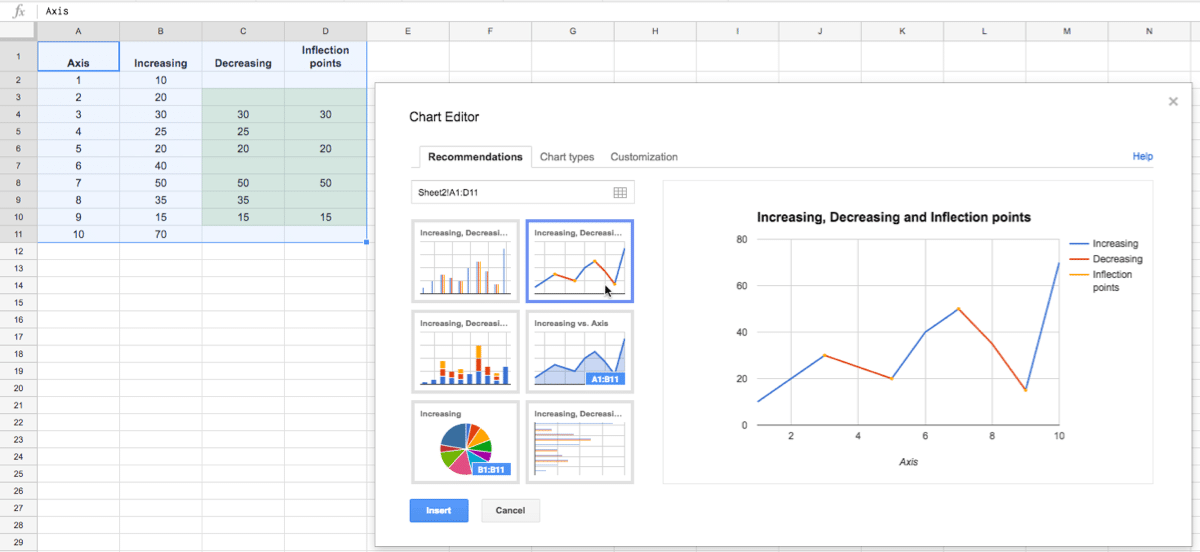
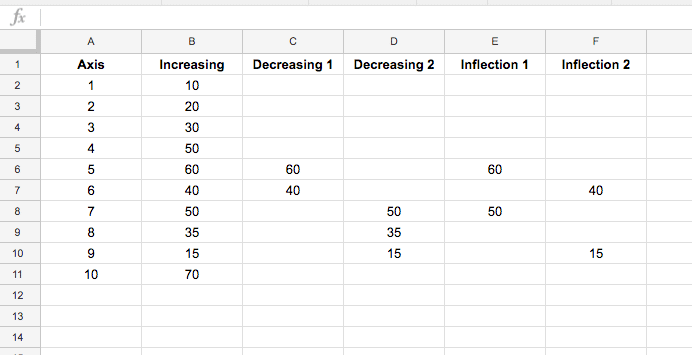
To create the colored version seen at the top of this post, we need to add helper columns to the dataset, one to create a dataset of decreasing values, and an optional column to mark the inflection points (where the line changes from going up to going down, or vice versa).
The finished dataset looks like this:
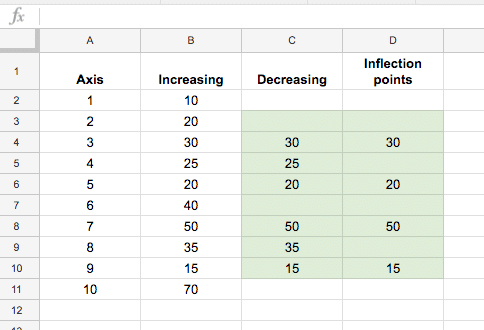
The green highlighted cells contain formulas to calculate the decreasing data and the inflection points (see below). The first and last lines in column C and D (cells C2, D2, C11, D11 in this case) are left blank.
The IF function in column C, starting in cell C3 down to C10 is:
=IF(OR(B3>B4,B3<B2),B3,"")The formula in column D, for identifying inflection points, starting in cell D3 down to D10, is:
=IF(OR(B3=MAX(B2:B4),B3=MIN(B2:B4)),B3,"")With this data table setup, highlight the whole table (use Ctrl + A, or Cmd + A on a Mac, to do this quickly) and Insert > Chart...:
Then simply format to the style you want, such as coloring the Increasing Series in green and the Decreasing Series in red:
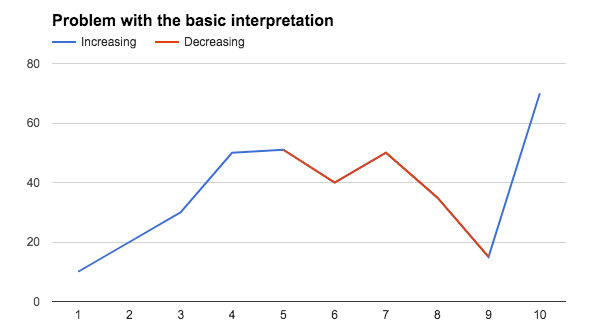
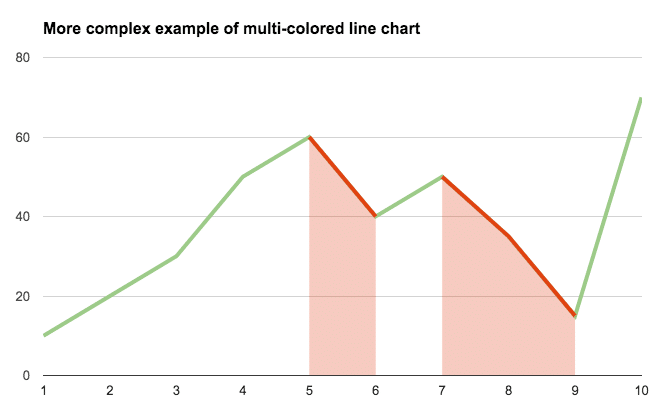
Problem with this basic interpretation of this chart
This method has a drawback though, if you have adjacent inflection points, i.e decreasing – increasing – decreasing, then it tricks the chart so it colors the whole section decreasing, as shown in this image:
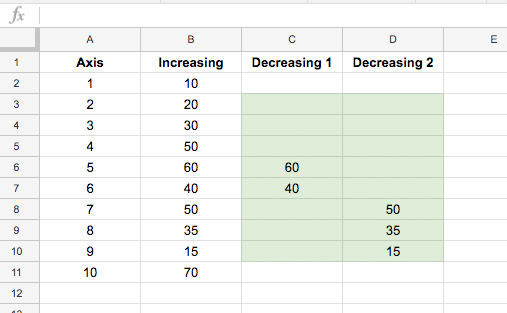
The fix
If you encounter this issue of adjacent inflection points, then you’ll need to create additional decreasing series to separate them, like this example dataset:
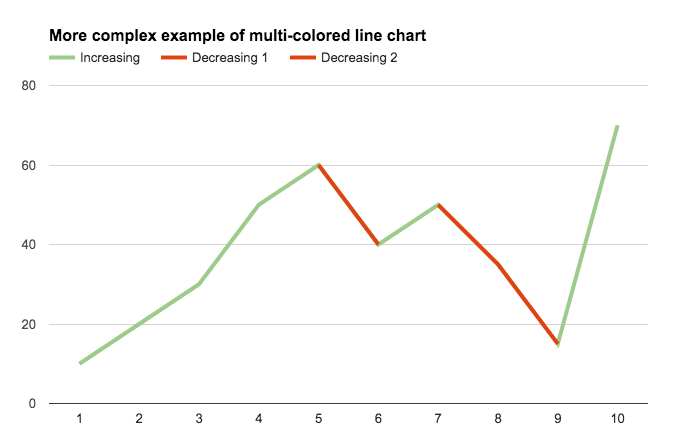
The final chart will then look like this:
Add the inflection point values
Again we need to split the inflection point data into two columns so there are no adjacent inflection points in these series. The dataset now looks like:
and the final chart:
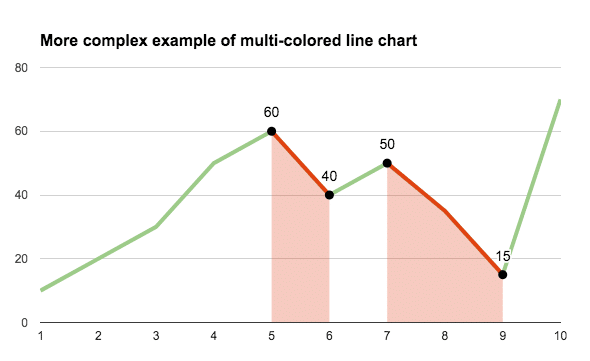
Even more customization options
Select the Combo chart instead of the straightforward line chart and change the increasing series to a line and the decreasing series to area charts:

Your final chart will look like this:
And here’s the version with the inflection points marked:
Hi Ben,
This is regarding your post about Multi-colored line charts in Google Sheets (https://www.benlcollins.com/spreadsheets/multi-colored-line-charts/)
This has been super helpful for me and I couldn’t find any other post that addresses this topic. I’m also trying something similar with my data and generate a multi-colored line chart as per “The fix” you’ve mentioned in your page.
However I’m trying to automate the population of the “Decreasing 1” and “Decreasing 2”, but I’m unable to figure out the logic behind.
Is there a way these columns can be auto-populated using formula?
Your assistance is greatly appreciated. Please do let me know if I can share with you the Google sheet that I’m working on.
Regards,
Mano Acharya