Slicers in Google Sheets are a powerful way to filter data in Pivot Tables.
They make it easy to change values in Pivot Tables and Charts with a single click. Slicers are extremely useful when building dashboards in Google Sheets.
Video: How Slicers Work And How To Add Them
What do Slicers in Google Sheets do?
Consider this basic dashboard in a Google Sheet. It consists of three small pivot tables and a chart, displaying (fictional) data about house sales.
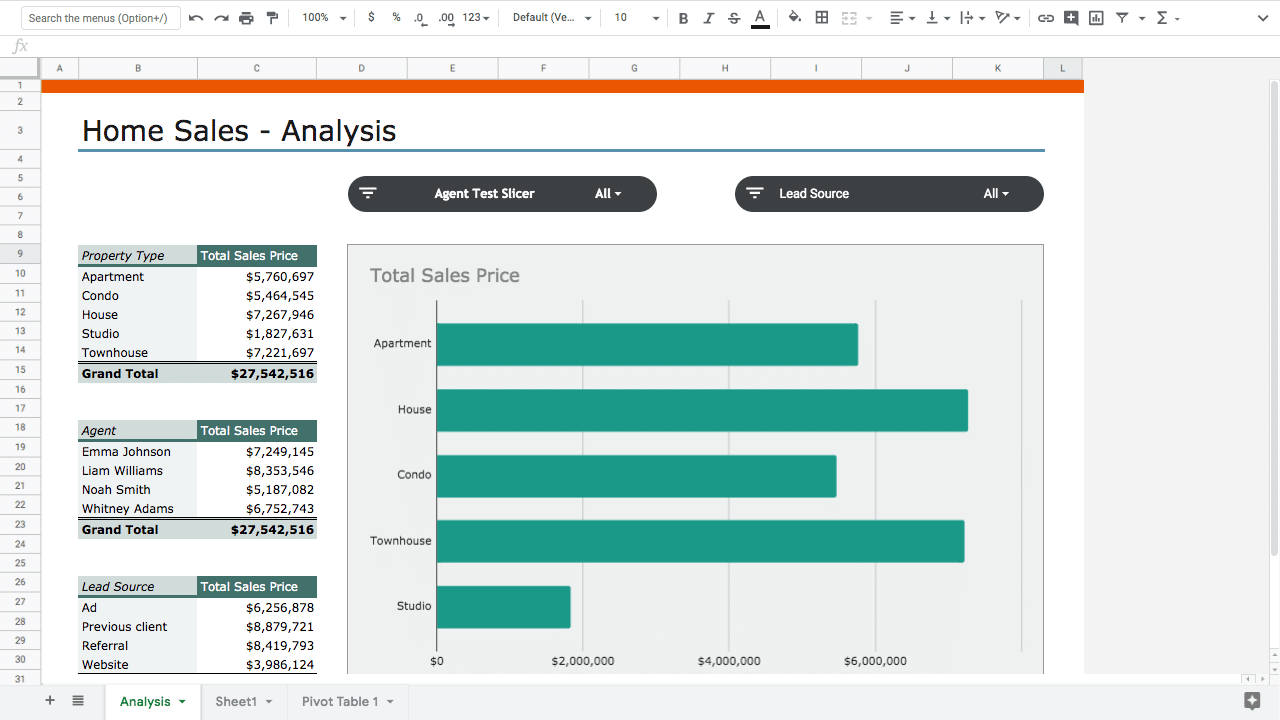
You’ll notice the two black boxes above the chart labeled “Agent Test Slicer” and “Lead Source”. These are slicers in Google Sheets.
When you click on the drop-down arrow in the slicer, it brings up a filter menu:
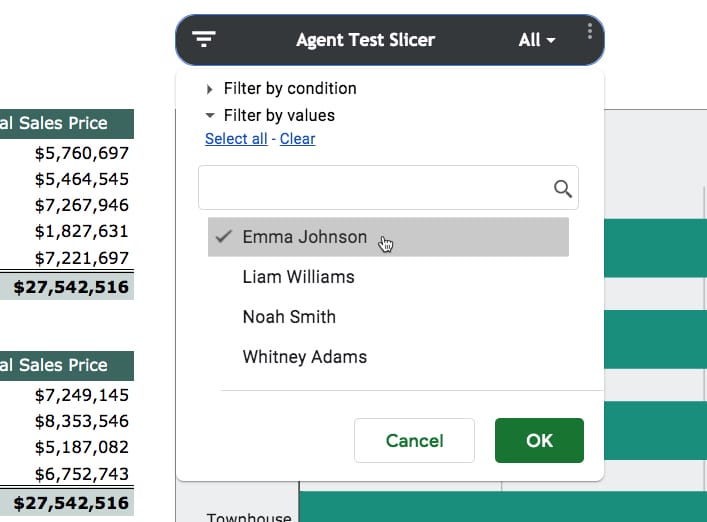
In the Home Sales dashboard example above, we can click on the slicers to focus on a subset of agents and/or subset of lead sources.
For example, we might select “Emma Johnson” only, so that we can see data that is just relevant to this person.
The three pivot tables (labeled 1, 2 and 3 in the image below) and the chart (labeled 4) are all updated to just show the rows of data from our dataset that are associated with “Emma Johnson”.
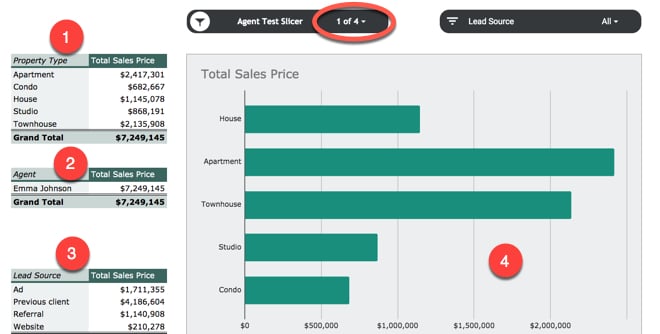
You’ll also notice that the slicer has updated the drop-down to say “1 of 4” instead of “All”, to signify that we’ve filtered on one value (“Emma Johnson”) from a possible set of 4 names.
(Note: you can absolutely choose more than one value at a time in your filter.)
How do you add a Google Sheets slicer?
Slicer Template
Feel free to make your own copy of this file (File > Make a copy…)
Slicer Template including the Home Sales Dashboard
The Data
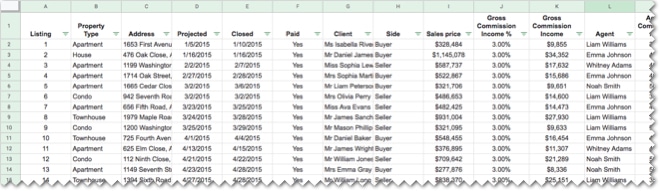
Start with this table of fictitious real estate data (from Sheet1 of the template above):
Create a Pivot Table
If you’re new to Pivot Tables, have a read of Pivot Tables in Google Sheets: A Beginner’s Guide
Back in the real estate dataset, insert a Pivot Table: Data > Pivot Table
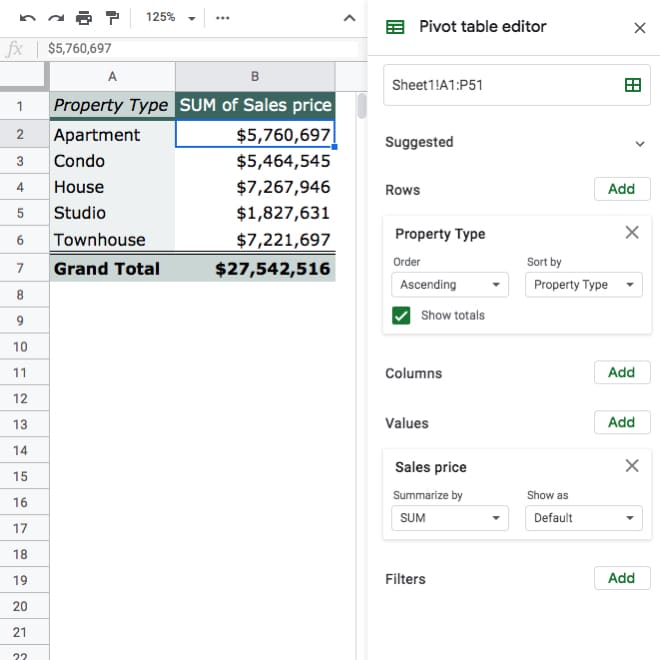
Create a simple Pivot Table in a new Sheet, for example this one shows property types and total sales price for each category:
Add a Slicer Control
Back in the Data menu, choose: Data > Slicer
If your cursor was inside the Pivot Table when you added a Slicer, it’ll be added automatically and you’ll see the default slicer control:
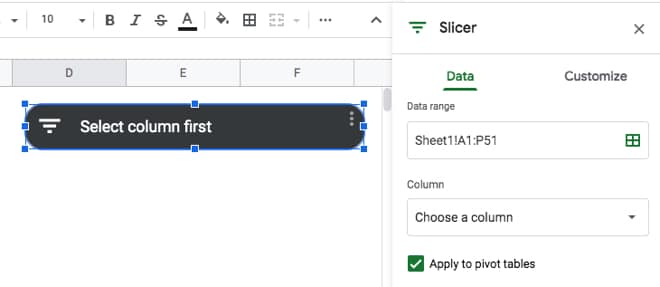
If your cursor was outside the Pivot Table in another cell, you’ll be prompted to choose the data to use inside your slicer.
The first thing to do with a slicer is to select a column.
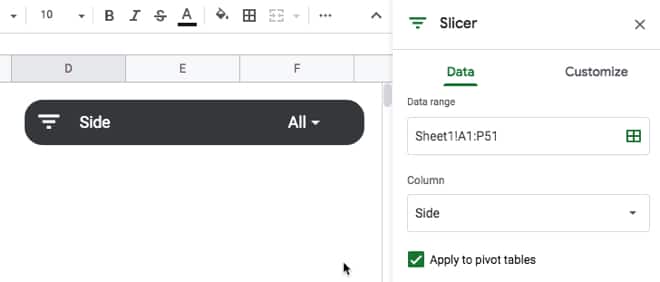
In this example, let’s choose the “Side” column, which is the column containing data about whether the agent acted as a Buyer or Seller in the transaction.
Our slicer will update to show the column name:
We now have a perfectly good, working slicer.
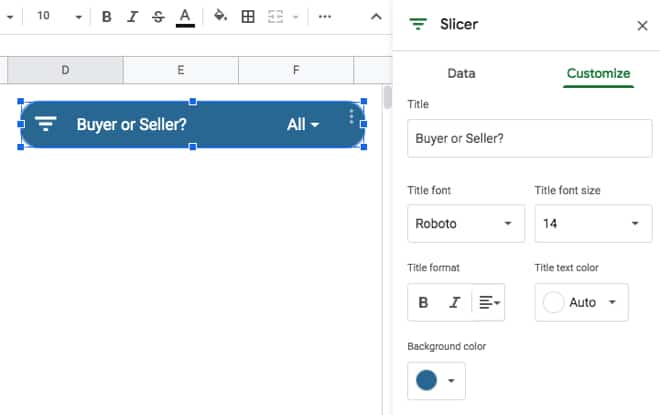
However, you can customize it under the “Customize” menu and change the heading and formatting.
Here we give it a more descriptive title and change it to have a blue background:
Slicer Settings Menu
When you’ve finished setting up your slicer, you can get back to the editing menu by clicking the 3 dot menu next to the drop-down. This brings up the slicer’s settings menu:
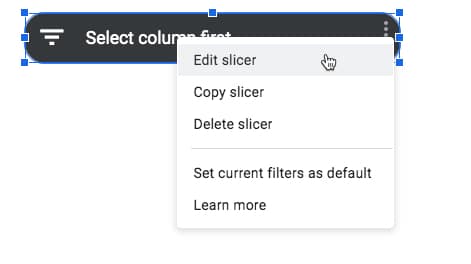
You can choose to copy the slicer (super helpful if you need to create several slicers), edit it, delete it or set the current filters as default.
Using Slicers
Clicking the drop-down arrow brings up the slicer filtering menu.
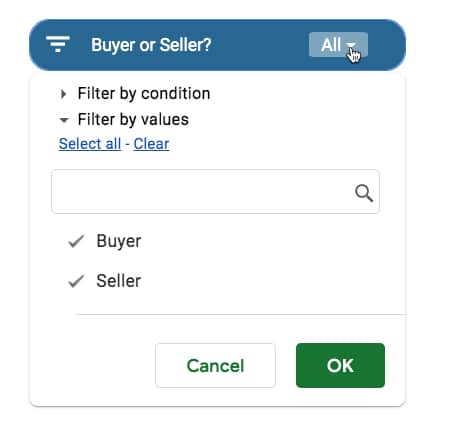
This will look familiar if you use Filters with datasets in Google Sheets. It has exactly the same functionality, but now exists in a standalone control that you can position next to Pivot Tables and Charts as part of a dashboard report.
The data in our Pivot Tables will update when we change the filter applied in our Slicer menu.
Look at the data in the Pivot Table changing in this example as I change between Buyer and Seller:
I can’t wait to explore slicers in more depth and start adding them to more complex dashboards.
More information
Announcement: Additional tools for enhanced reporting in Google Sheets on the G Suite Updates Blog
Filter charts and tables with Slicers in the Docs Editors Help page.
Do you know whether slicers will work like Filter Views i.e. specific to the user? If I could build my dashboard and allow users of the same sheet to slice it for different areas/divisions of the company – WITHOUT affecting other users’ views – that would make a real difference.
Yes, that’s how slicer will work.
I wonder what the general opinion will be of google sheet slicer vs datastudio – I’ve been stepping away from data analysis in sheets and instead plugging into a datastudio, so will be interesting to compare the user functionality/friendliness!
Wondering exactly the same thing myself. For my use case, sheets is normally enough in terms of rough dashboards for internal use, and this takes away a big difference between the two suites. I think I may be hanging around in sheets much more…
I’m GSuite and we don’t have it yet (noted your 15-day warning about that) so can’t play with it yet. Will I find that I can add these to sheets/pivot tables that already existed before August, or will I have to “convert” my sheet somehow to get it on those?
I’ve been waiting a very long time for this functionality! Can’t wait for it to be implemented for my account.
Mr. Collins,
Is there a way to save the condition setting for each slicer? I’m calculating information relevant to the the current month, specifically for a budget. Each time I reload the sheet, the slicers reset. This is the only drawback I have noticed about them.
Thanks for your time and effort!
I have the same question?
I just figured out a workaround for this. If you right-click on the slicer it will give you the option to “set current selection as default” That will “freeze” your selections until you change them. It’s not a horrible workaround as it only takes two clicks to make it happen and is easily updatable as the months roll by.
Hi Jason,
What you did seems to be the ‘official’ way of doing it, than a workaround.
If we click ‘Learn more’ on the slicers, a help page opens & then there’s a section where this is stated to ensure slicer settings are maintained when the file is closed & reopened.
In the animated gif for the spreadsheet illustrating Slicers, Scorecards, and Themes (http://shorturl.at/invBV), why do the sheet tabs look so different than my sheet tabs? Is it a browser issue? Also, the second sheet has a database icon in front of the name. New feature or one I’ve just overlooked all this time?
Do you know if there is a way to exclude the Blank data rows in the Slicers? I have a sheet that grabs data from the entire column (since the column is constantly updating with new data), but in doing this it shows my options for the Slicer a (Blank), A, B, C, etc…
Filter it at the Pivot Table level
I just figured out a workaround for this. If you right-click on the slicer it will give you the option to “set current selection as default” That will “freeze” your selections until you change them. It’s not a horrible workaround as it only takes two clicks to make it happen and is easily updatable as the months roll by.
Hi There,
I am finding that it where I have dashboard charts on another tab it is not allowing me to create or copy across the original slicer so therefore not updating the pivots. This means I am having to filter on the pivot sheet then tab across to the dashboard to see the updates. Are you aware if this is intentional?
Slicers seem useless on the Android mobile app, you can’t even click it
Not sure if I’m just missing it.. but should the slicers work across the workbook? Or are the designed to only work within the SAME Sheet where the slicer resides? My gut tells me that given you define the Data Range of the Slicer, it should work – but doesn’t seem to? Am I missing something?
Hi Tracy, Slicers are attached to a specific data range (i.e. table of data) but don’t have to be on the same sheet as that dataset. In addition you can choose to apply them to pivot tables as well.
Hope that helps!
Ben
Hi Ben! I applied a slicer with a scorecard on a separate tab and they are not connecting even though I applied them to the same range. Do you have any idea what may be the cause?
After I made a slicer in one of the sheets of a Google sheets book, I can no longer see the ‘Create filter’ option in the Data menu, even after I removed the slicer.
What should I do to be able to Create a filter different from the one I can make with slicer?
Neither could I modify the
Hi,
The same thing happend to me: I can no longer set up my “simple” filter as before, although I have removed the slicer I created.
Did you manage to find a cure for this?
Zoltán
Can Slicers use dynamic ranges?
Slicers dont work on a google sheet with protected ranges…Any workaround available ? Thanks.
Is there a way to make it fix? Similar to the “don’t move or size with cells” function in Excel
Nice, but I like Excel’s implementation of slicers a lot better. With Excel you can actually see the values chosen in the slicers themselves and their display of said values is highly customizable. Sheets’ slicers show ‘1 of 5’ as the value. Really? Useless if you want to share a screenshot or print it out or just know at a glance what the current filter criteria is.
Add a small pivot table beside your charts that will show the Slicer’s selected values. Ben was showing here https://www.benlcollins.com/wp-content/uploads/2019/08/dashboard2-768×432.png
Still a poor alt to Excel slicers. Very clunky and some odd bugs, such as the main col & row headers freezing when a slicer is active. Ugh!
I’m wondering the same thing as Mona. Is there a way to prevent slicers from being moved?
Hey Ben! I have a chart based on course survey data. Folks can respond to questions on a scale (strongly agree, agree, disagree, strongly disagree). When I add in a Slicer to filter by certain groups it shifts the chart bars around so they are no longer in the logical order from Strongly agree…->…Strongly disagree. Is there some way to “lock” the chart bar order regardless of the slicer setting so the bars always appear in the correct sequence?
Hello,
When using the “Filter views” tool on a Google sheet and you have long lines of text in your data rows you can’t adjust the “Filter view” box so that you won’t have to use the scroll bar at the bottom to scroll right to see all the rest of the text.
But with a SLICER you can adjust the size by clicking the SLICER till you see the “adjustment bar” around it and then click the right-middle box and drag right till you are able to see all the text without scrolling.
James/mreighties 🙂
I have 2 pivot tables in the same sheet to compare incomes between periods of time.
Pivot1 with date range A to B vs pivot2 with date range C to D.
Both read data from the sheet1.
I use pivot table editor filter for selecting date range A-B in pivot1 and date range C-D on pivot2.
Now I want to use 2 slicers, one for selecting date range A-B on Pivot1 and the other for selecting the range C-D on Pivot2, but doesn’t work. If I choose range A-B on the slicer1 the same date is applied to the Pivot2.
I will appreciate some clue.
Thanks
If someone has view only access can you make sure they get refreshed data in their slicer? Seems like you have to refresh the page each time… 🙁
Hi, i am using 4 slicers for my data and i use these slicers in combination. Is there a way to clear all filter at once without going to all slicers one by one to clear filters out? Thanks!
Clear all filters first then right-click on the slicer and save as the default filter then press F5 to refresh when you need it
I have to say that I am a disappointed in the Slicer function compared to Excel. I would use the ability to have a slicer with a list of, essentially buttons, quite a lot with data I needed to repeatedly filter. Much easier to Ctrl+click and select from the Excel slicer than having to use a drop down filter.
Wondered if you might have any suggestions for those forced to now work in the Google realm?