Build Dashboards and Kanban Boards with the Google Sheets Canvas Tool

With the new Sheets Canvas feature, we can build professional-looking interactive dashboards directly in our Google Sheets, using nothing more than natural language prompts. It’s a huge upgrade from how we used to build dashboards in Sheets.
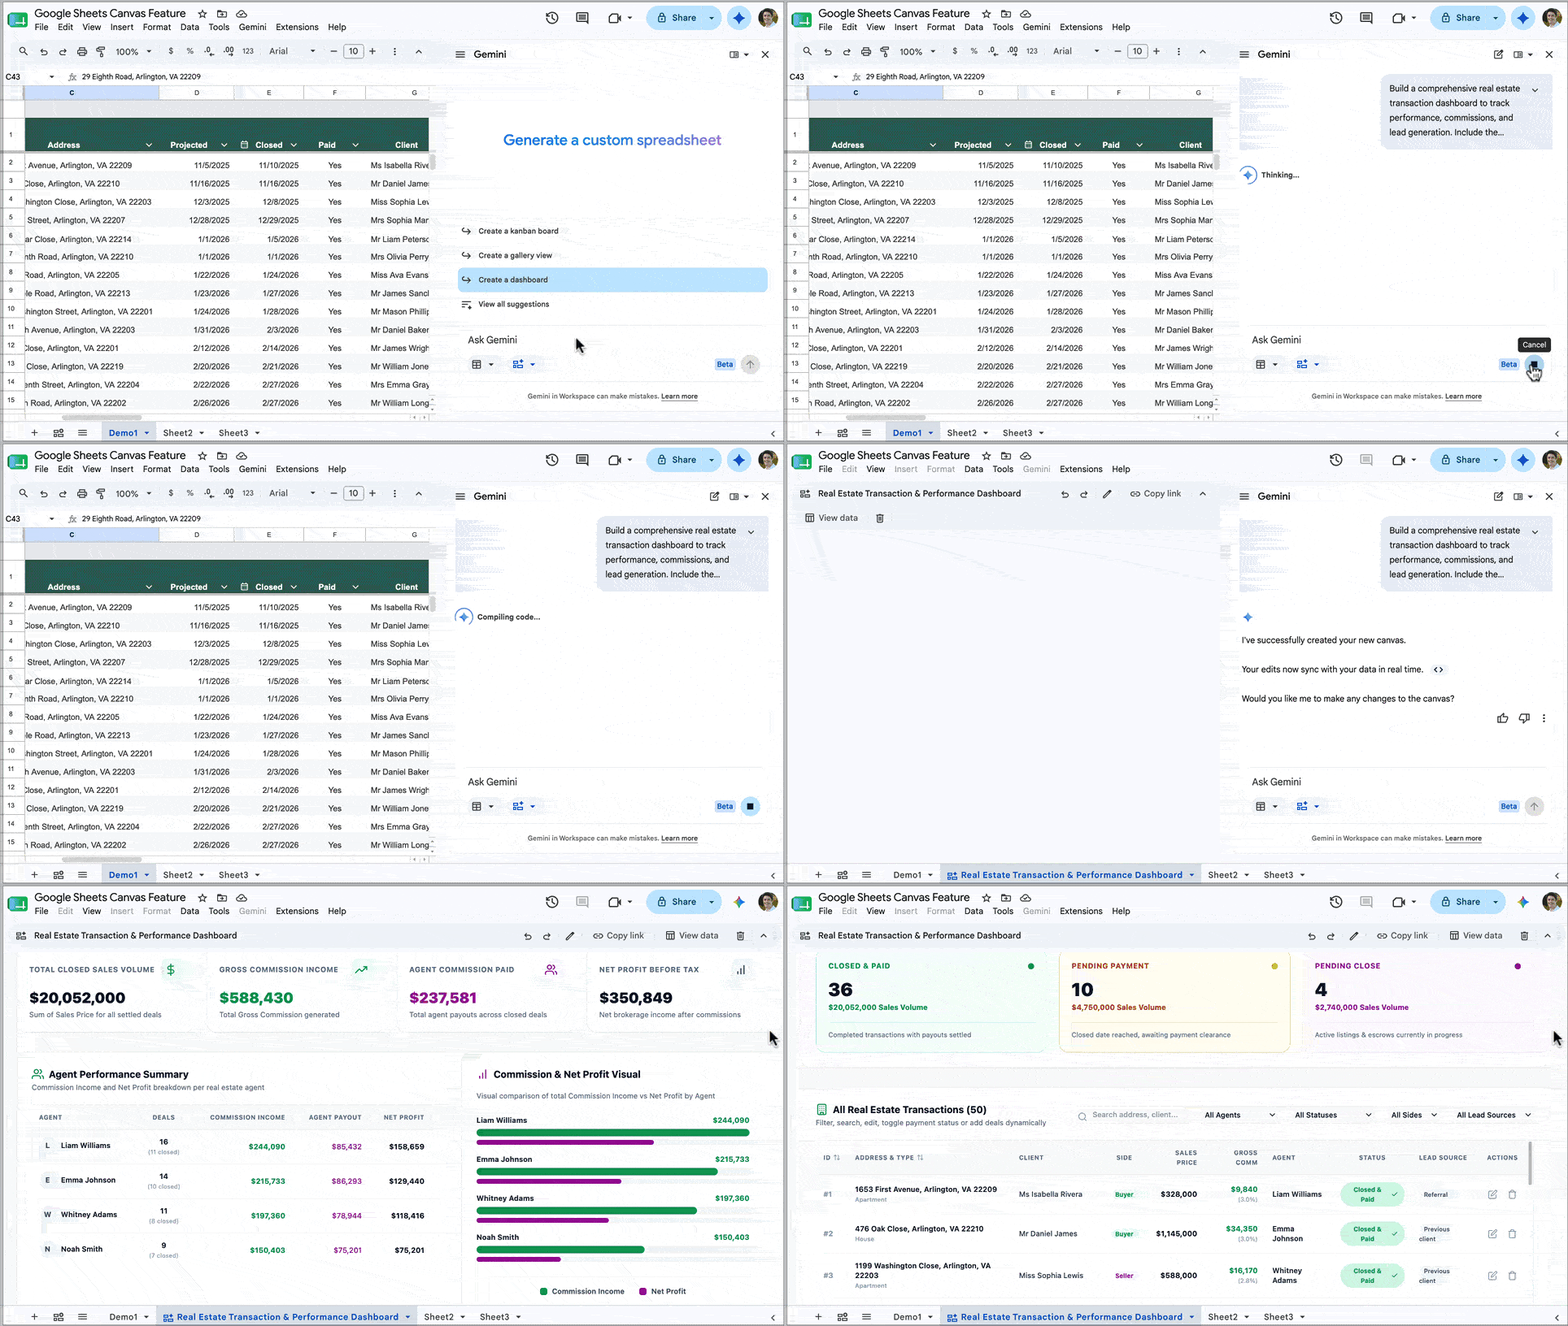
Sheets Canvas to build a professional dashboard

Previously, we clumped together charts and used formatting tricks such as borders and background cell colors to try and recreate a professional look. It was all rather challenging and time-consuming, with limited interactive options. (Read this post to see what I mean.)

Alternatively, we might have connected Google Sheets to a third-party tool, but these incurred extra costs, introduced security risks, and were often still pretty janky.

In this post, we are going to take a look at this new Sheets Canvas feature.

Sheets Canvas Availability

At the time of writing (August 2026), the Sheets canvas feature is only available to Google Workspace customers on Business or Enterprise Standard and Plus plans, or AI Pro for Education add-on subscribers, or to consumers on Google AI Pro and Ultra plans.

How To Build A Dashboard with Sheets Canvas

Firstly, you need to have your data ready to go in a Google Sheet, preferably in a Tables format, which is best for Gemini.

Secondly, it pays to think about your dashboard before launching into building it.

That way, you won’t end up building something that isn’t useful. Instead, you plan what information will be shown on the dashboard and how it will work, which will result in a more successful outcome.

For example, ask yourself these questions:

  • What are the key metrics to show?
  • Who is the intended audience for this dashboard?
  • How technically literate are they? Will they understand how to read complex charts?
  • How familiar are they with this data and its background context?

With your data and design plan to hand, you’re ready to start creating a Sheets Canvas.

There are three entry points:

  1. From the toolbar: Insert > Canvas
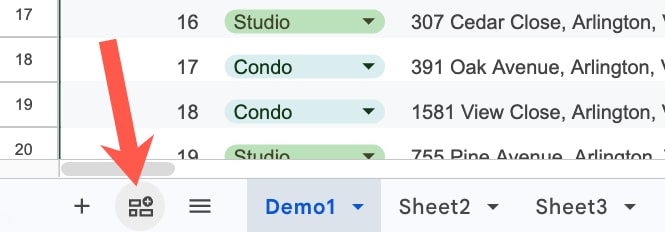
  2. Using the “Create a canvas” button in the bottom left of your Sheet, next to the Sheet names.
    (Both 1 and 2 open the Gemini sidebar with the Canvas option pre-selected.)
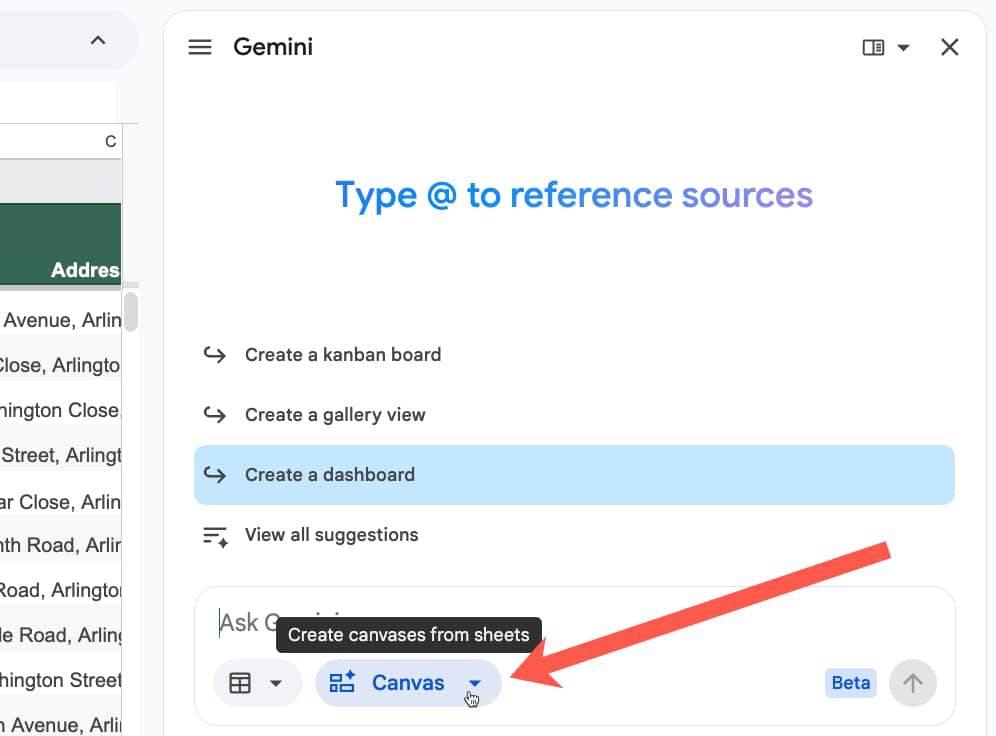
  3. You can select “Create canvas” directly in the Gemini sidebar too.

1. Insert menu:
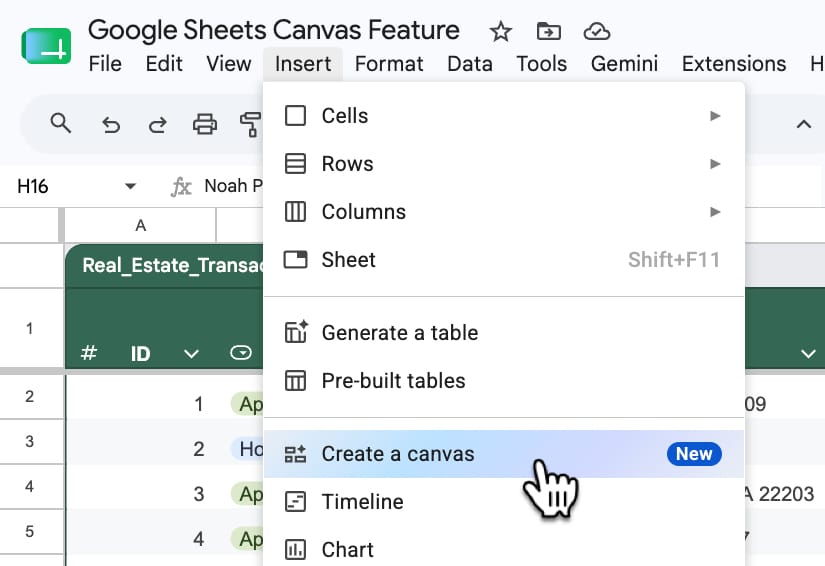
Toolbar menu to insert a Sheets Canvas

2. Create a canvas button:

Insert button for Canvas feature in Google Sheets

3. Create canvas in Gemini Sidebar:

Canvas feature in Gemini sidebar of Google Sheet

With Gemini sidebar open and the canvas feature selected, make sure you select the correct dataset(s) for the dashboard.

Use the button next to the Canvas option and choose the sheet containing your data. If you already have that sheet open, then it will automatically be selected, and you can deselect the other sheets if you don’t need them.
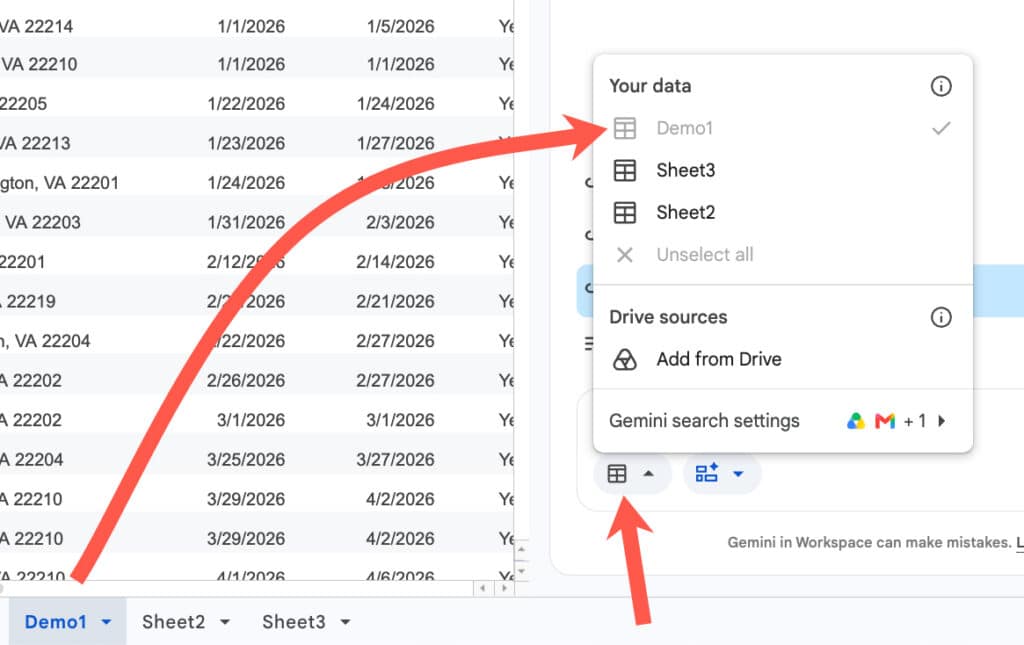
Select data in Sheets Canvas

Now you’re ready to insert your prompt.

Example 1: Real Estate Dashboard

Consider this dataset of real estate transactions:
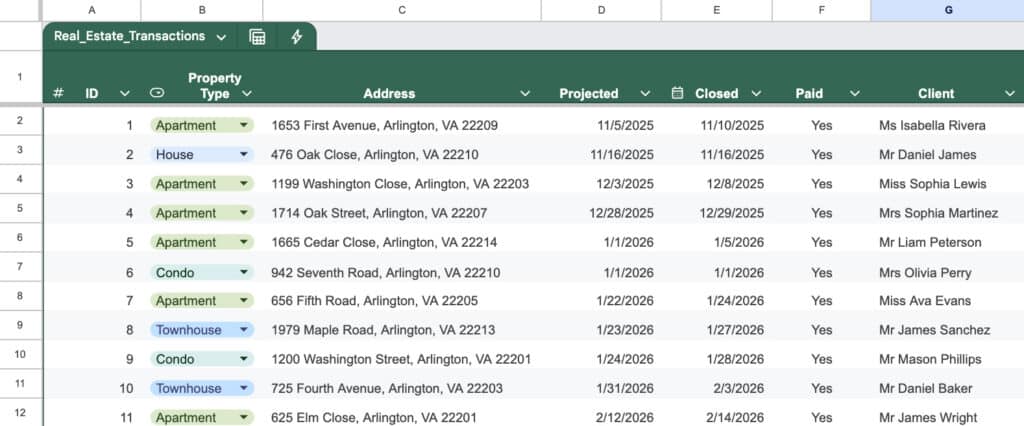
Real Estate data in Google Sheets

Here’s an example prompt to build a dashboard for this data:

Build a comprehensive real estate transaction dashboard to track performance, commissions, and lead generation. Include the following elements:

1. Key Performance Indicators (KPIs): Calculate the total sum of Sales Price, Commission Income, Agent Commission, and Net Profit for Tax for all “Closed” and “Paid” deals.

2. Agent Performance: Create a summary table or chart showing the total Commission Income and Net Profit generated by each Agent.

3. Lead Source Analysis: Create a bar chart breaking down total Sales Price and total number of transactions by Lead Source to see which marketing channels are most effective.

4. Buyer vs. Seller Split: Create a visual breakdown comparing the number of transactions and total Commission Income based on the Deal Side (Buyer vs. Seller).

5. Deal Pipeline: Provide a quick count of transactions categorized by Deal Status to show how many deals are currently pending versus closed.

Please format this with a clean, professional layout, using bold headers for each section and placing the charts logically next to the summary tables. 

Use hex color #0F9E59 as the primary color and #9E0F9C as the secondary color.

Pro Tip: Save your best dashboard prompts in a prompt library for future reuse.

Typically, Gemini takes a few minutes to build the dashboard, depending on how complex your prompt is.

The output for the real estate data example looks like this:
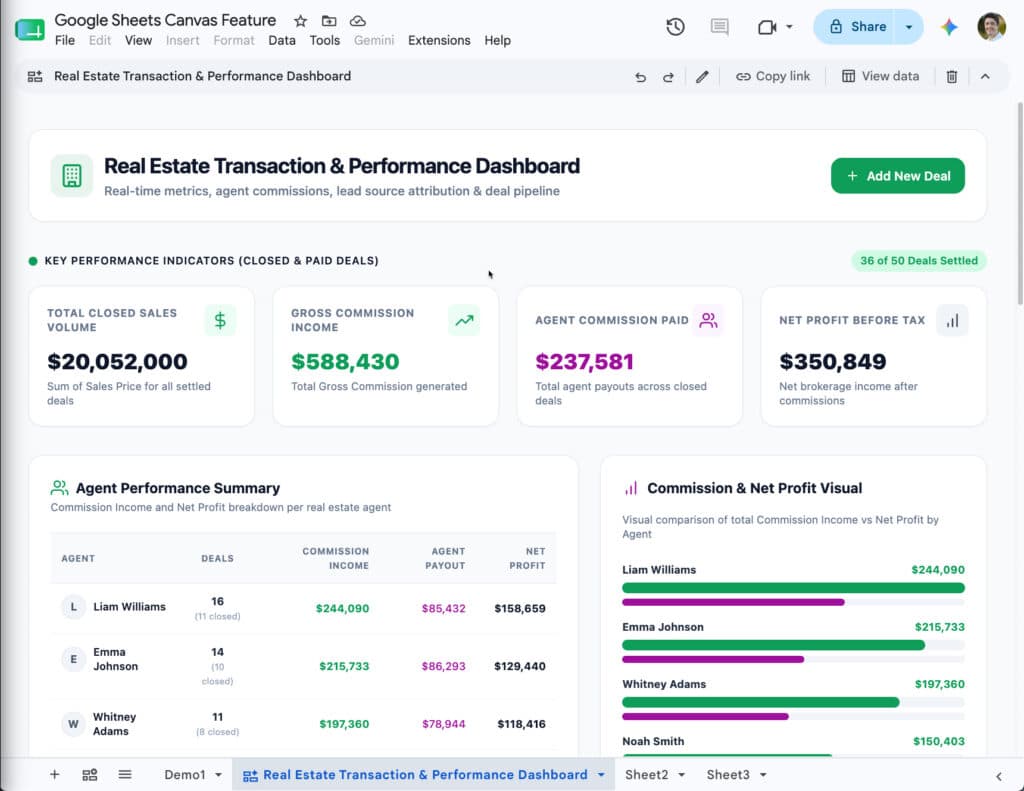
A real estate dashboard built using Google Sheets Canvas

Notice how the colors match the colors mentioned in the prompt (#0F9E59 as the primary color and #9E0F9C as the secondary color).

Also, notice the “Add New Deal” button in the top right corner. When you click this, it opens a pop-up with a form to add new deals:
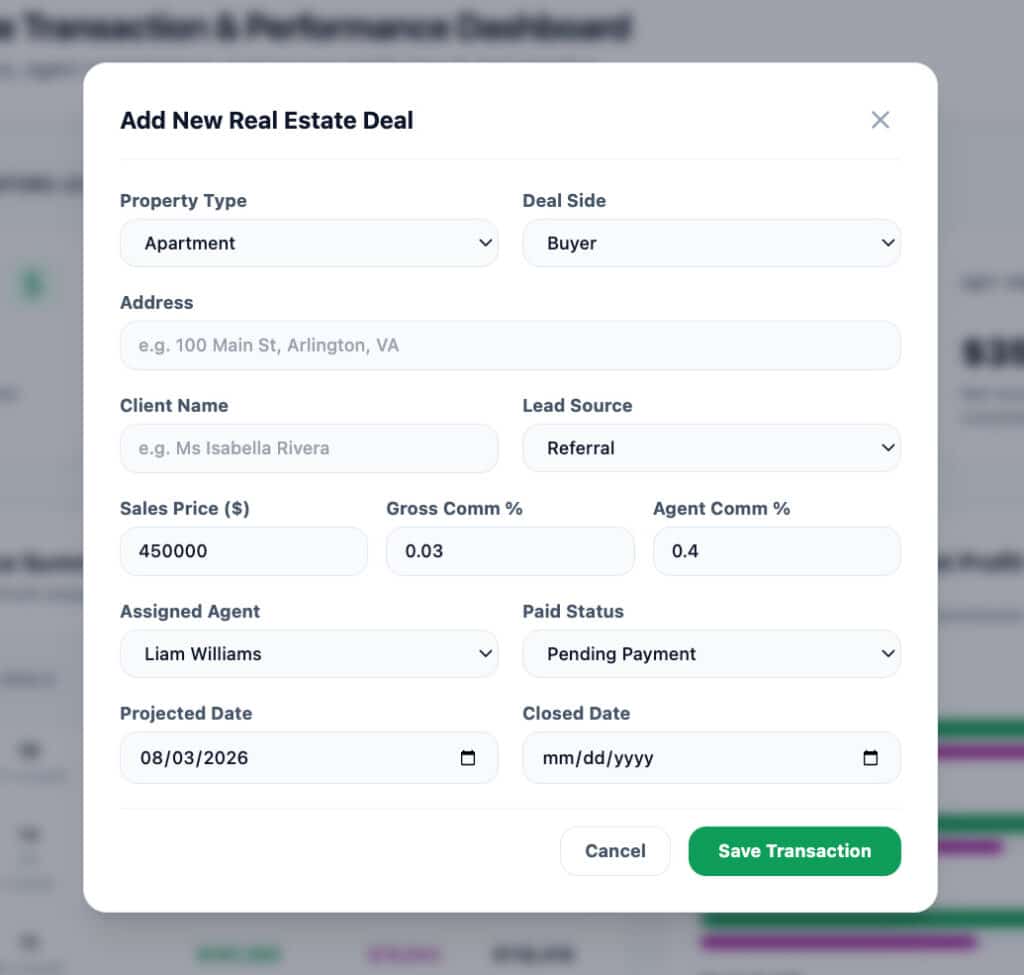
Add new data button in Sheets Canvas

This data is inserted directly into your original data table in Google Sheets. It’s a great way for users to add new data without leaving the dashboard view, and it saves users from needing to navigate the data in the spreadsheet itself.

At the the top of the canvas is a small edit bar for making changes, sharing, or deleting the canvas:

To use the “Copy link” button to share the canvas, you need to first grant file access (through the regular “Share” button in the top right of your Google Sheet) to anyone you want to share the canvas with.

Example 2: Kanban Board

The Sheets canvas tool is not limited to regular dashboards, though.

It can also build interactive Kanban boards, which is my favorite use case and a killer feature.
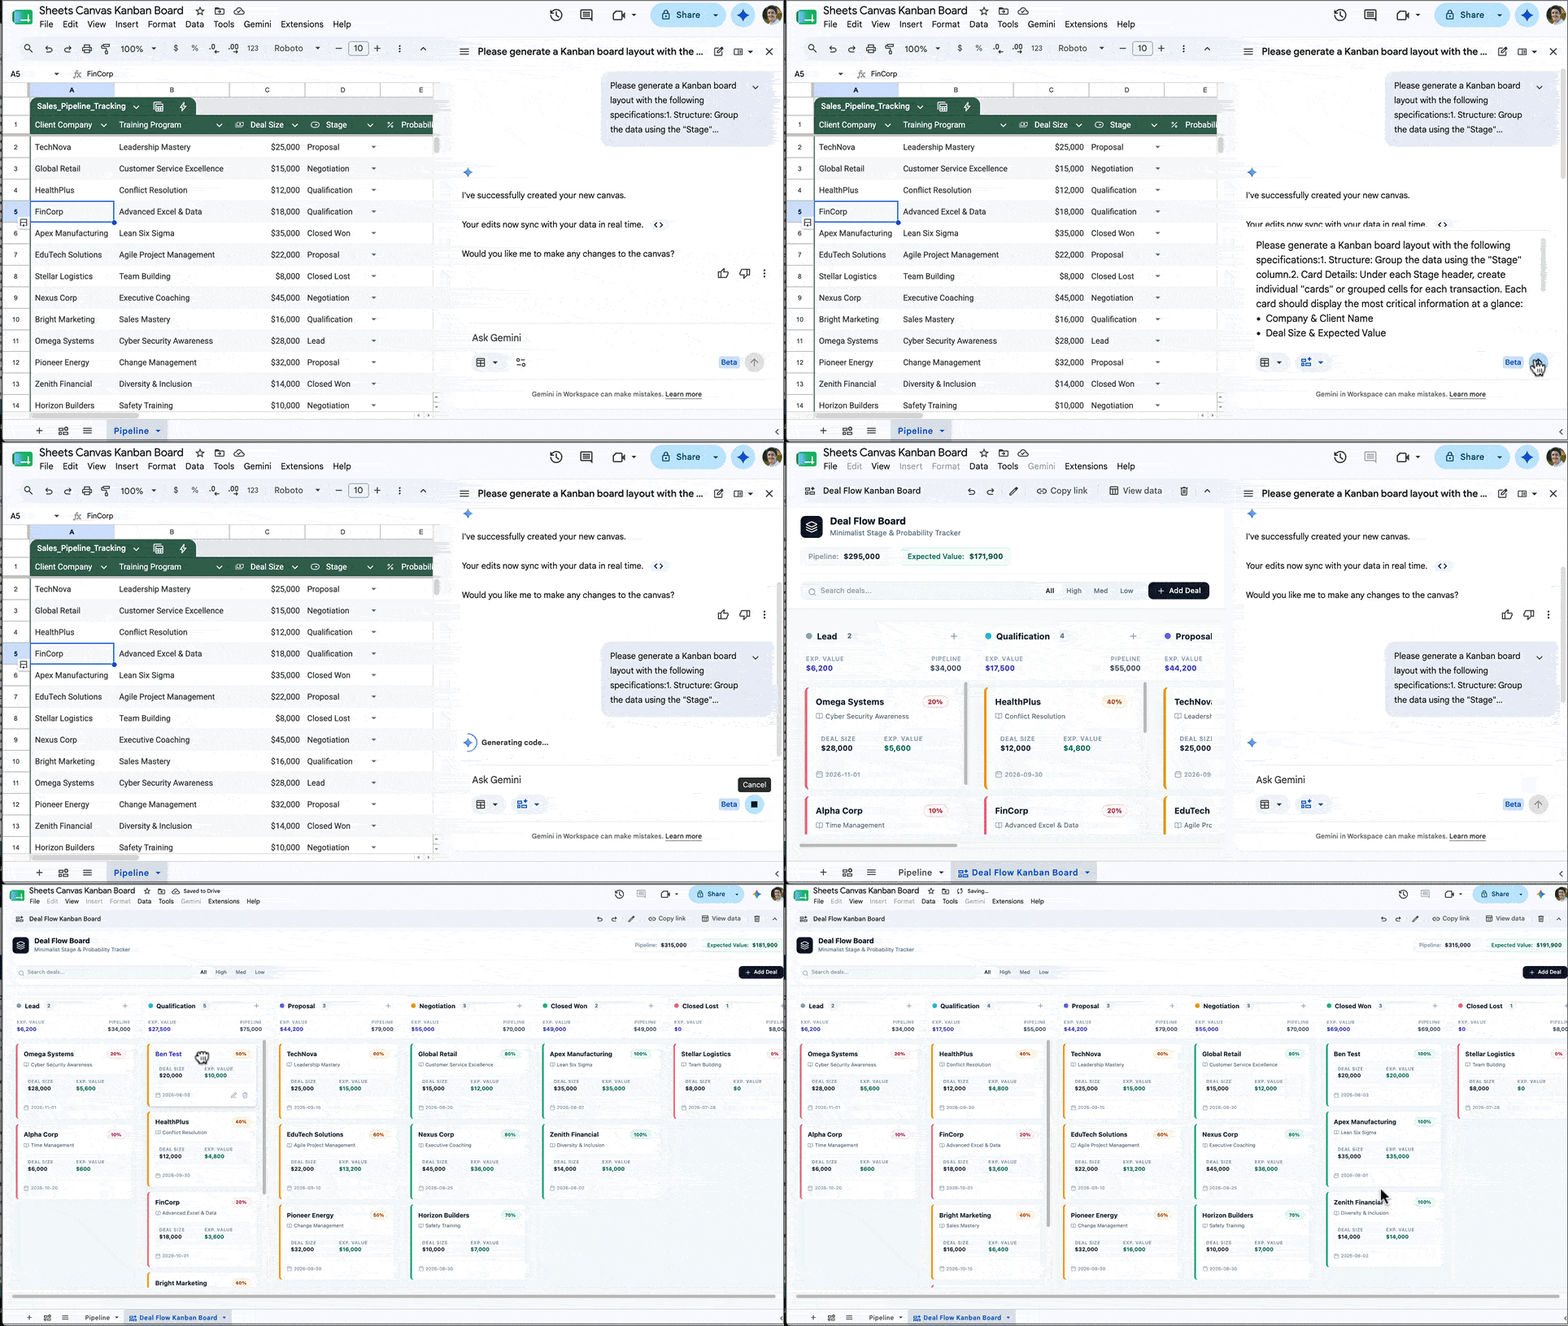
Build a Kanban board in Google Sheets with the Canvas feature.

Kanban boards are visual project management tools that organize tasks into columns and allow you to drag and drop cards between these columns.

Previously, this sort of interactivity was impossible inside of Google Sheets, but now with this new Sheets Canvas feature, you can build a fully featured Kanban board with a single prompt.

For example, here is a client pipeline data set for training contracts:
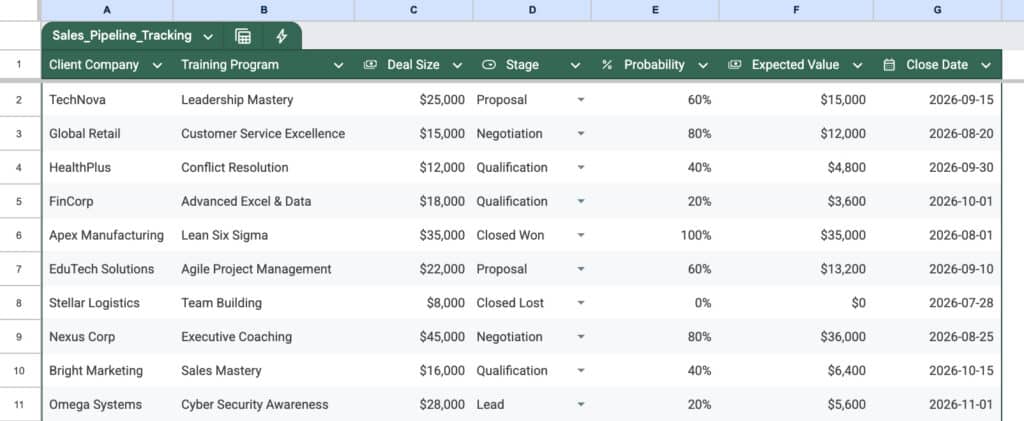
Sales Data Pipeline in Google Sheets

And here’s an example prompt to generate a Kanban board from this data:

Please generate a Kanban board layout with the following specifications:

1. Structure: Group the data using the “Stage” column.

2. Card Details: Under each Stage header, create individual “cards” or grouped cells for each transaction. Each card should display the most critical information at a glance:

  • Company & Client Name
  • Deal Size & Expected Value

3. Formatting:

  • Please apply conditional formatting or color-coding to the cards based on the “Probability” column (e.g., green for high probability, yellow for medium, red/gray for low) so I can easily identify which deals are most likely to close.
  • Ensure the layout is clean and minimalist.

The output from this prompt looks something like this:
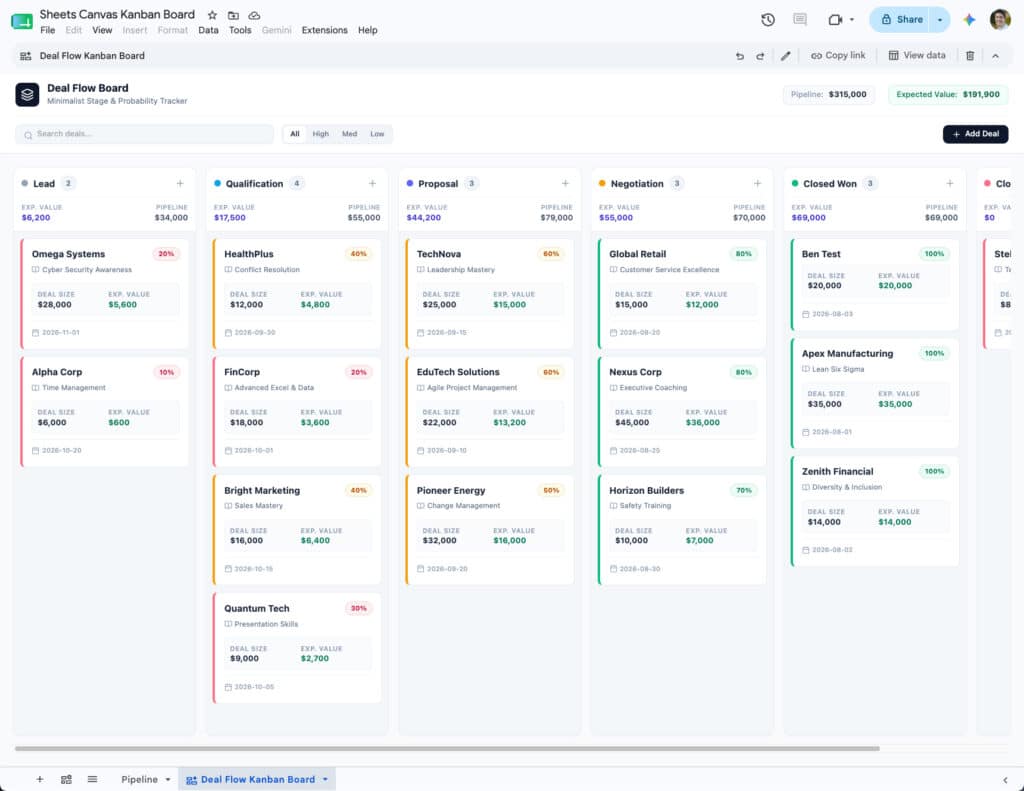
Kanban Board in Sheets Canvas

You can then drag these cards into different columns as needed to show progress. When you drag a card into a new column, the data in the underlying sheet also updates to reflect that, so they are always synced in real time.

And as with the dashboard from earlier, there is also a button to add new data from the Kanban canvas rather than having to go back to the actual spreadsheet data.

Limitations

At the moment, if you want to modify the dashboard generated by the Sheets Canvas tool, you give it an additional prompt in the Gemini sidebar. For example, you might prompt Gemini with “change the leads pie chart into a bar chart“.

Unfortunately, when Gemini updates the dashboard, other elements might inadvertently change too.

I think the real breakthrough will come when we can click on individual features within the Dashboard or Kanban board and give specific instructions to modify that specific feature only with a prompt. Hopefully that is something coming down the line.

Conclusion

This new Sheets Canvas feature is a fantastic tool that dramatically expands the possibilities of what you can do with data in Google Sheets.

And, whilst the regular chart tool will remain extremely useful for specific analysis and one-off charts, the old way of building dashboards is rapidly becoming obsolete.

I can’t imagine spending hours manually positioning charts, hand-picking background cell colors and borders, and all manner of other dark arts, to build a dashboard the old way, knowing it wouldn’t even look half as good as what this new canvas tool can build in a few minutes.

If you have access to this canvas tool, then I encourage you to experiment with it to build your dashboards.
Multiple Selections in Drop Downs in Google Sheets

The drop down menu feature in Google Sheets is useful for efficient data entry. It can also be used to create dynamic spreadsheets, for example, dashboards that change based on choices a user makes.

At the end of July 2024, Google announced multiple selections in drop downs (scheduled to roll out in late-August/early-September). This is great news that will give us even more flexibility in our spreadsheets.

In this post, we’re going to take a look at this new drop down feature:

Multiple Dropdowns in Google Sheets

How to Enable Multiple Selections in Drop Downs

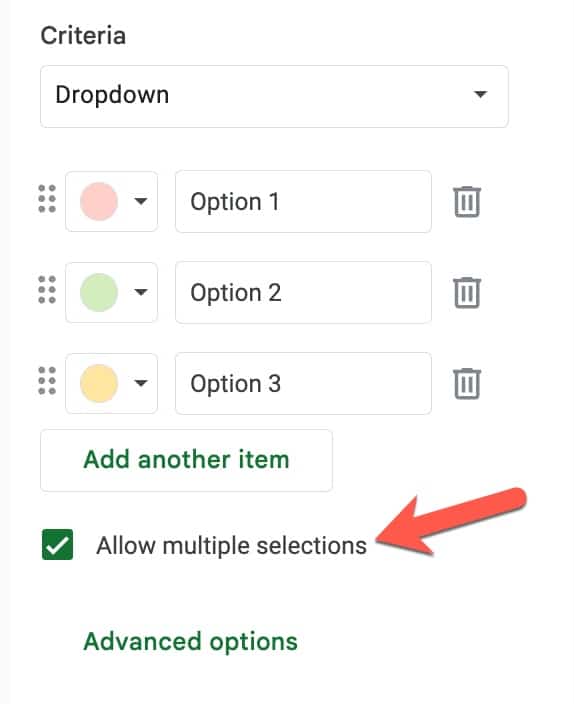
To enable multiple selections, create a regular dropdown and then check the box that says “Allow multiple selections”:

Allow Multiple Selections in Google Sheets dropdown

Boom! 💥 That’s it.

Working with Drop Down Multiple Selections in Formulas

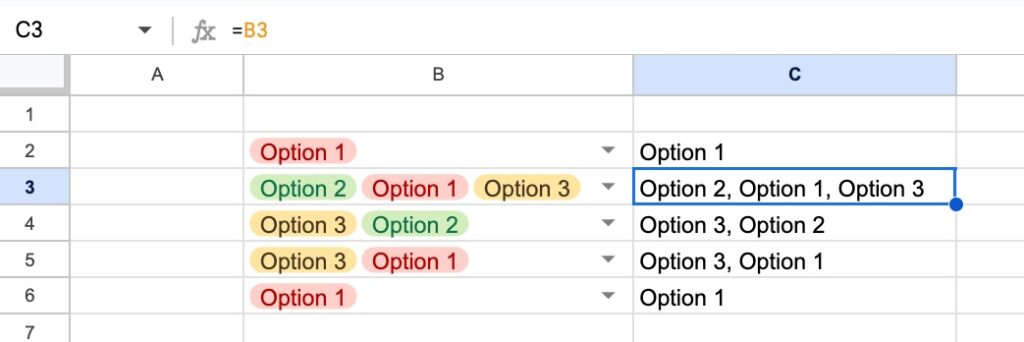
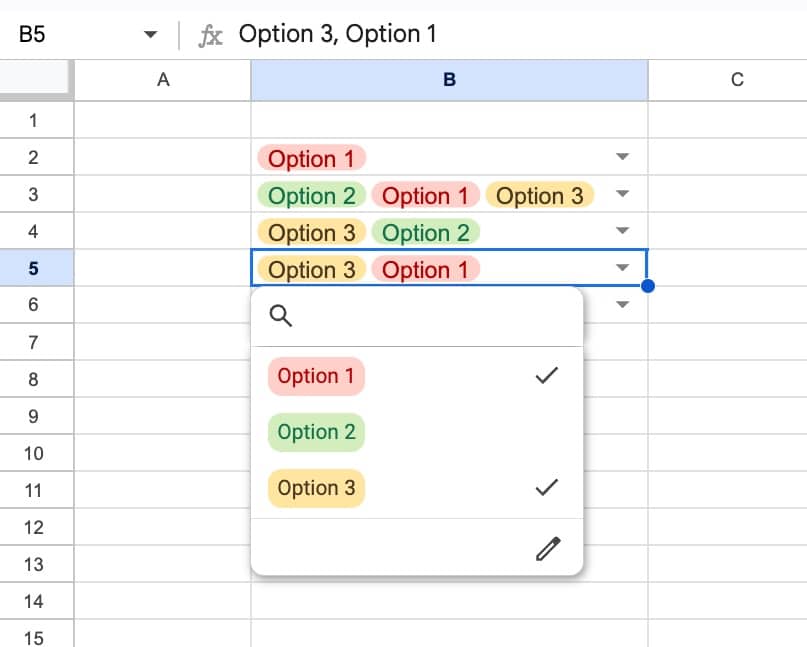
If you select multiple options from a drop down menu, the output is a comma separated list:

Multiple Selections in Drop Downs in Google Sheets

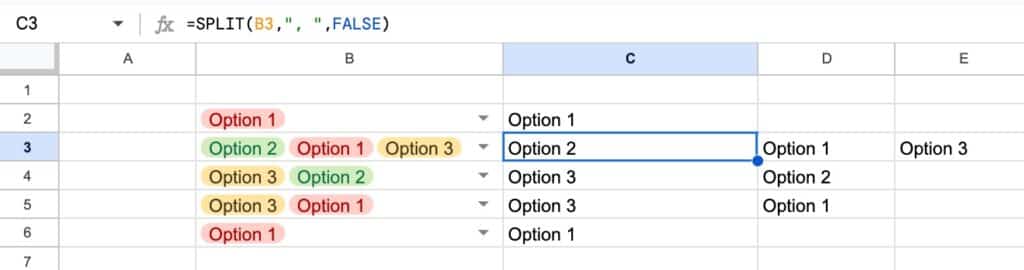
To work with them in formulas, we use the SPLIT function to separate the choices into their separate parts.

Note the space after the comma. We need to be mindful of this in our formulas. Split out the comma-separated lists with this formula, which accounts for the space too:

=SPLIT(B2,", ",FALSE)

It looks like this in our Sheet:

Split formula for multiple Dropdowns

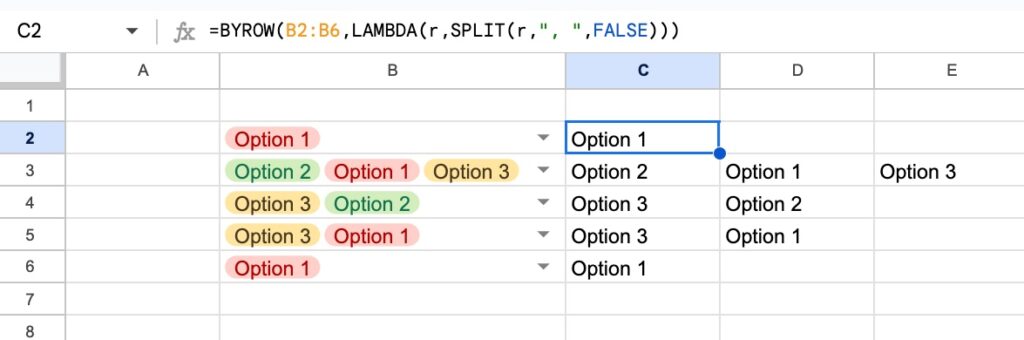
We can use a BYROW function to expand this SPLIT formula to work with a range of multi dropdowns. This single formula in cell C2 splits out all the cells in the range B2:B6 and outputs all the data in C2:E6 range:

=BYROW(B2:B6,LAMBDA(r,SPLIT(r,", ",FALSE)))

In our Sheet:

BYROW and SPLIT with multiple dropdowns

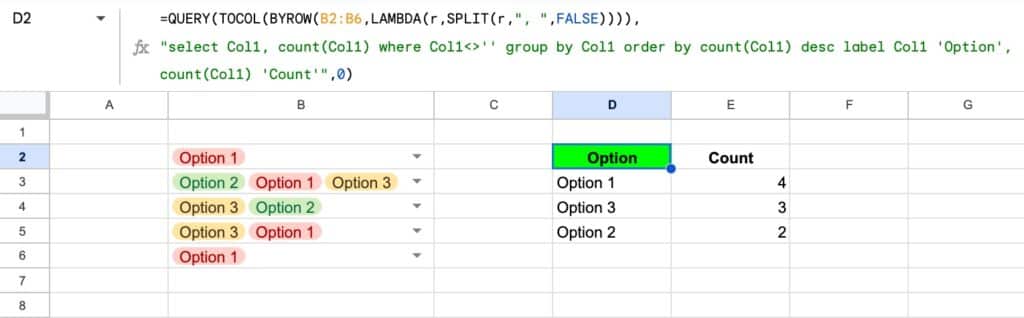
Finally, we could wrap this with a TOCOL function and a QUERY function to count our choices:

=QUERY(TOCOL(BYROW(B2:B6,LAMBDA(r,SPLIT(r,", ",FALSE)))),
"select Col1, count(Col1) where Col1<>'' group by Col1 order by count(Col1) desc label Col1 'Option', count(Col1) 'Count'",0)

In our Sheet:

Multiple Selections in Drop Downs with QUERY

Google Apps Script: A Beginner’s Guide


28 Days to Gemini Mastery

New course

Stop dabbling with Gemini. Start building AI systems.

One-off prompts → repeatable workflows Gemini across all your Workspace tools
Automations and agents that save hours NotebookLM, vibe coding, Gemini Gems

What is Google Apps Script?

Google Apps Script is a cloud-based scripting language for extending the functionality of Google Apps and building lightweight cloud-based applications.

It means you write small programs with Apps Script to extend the standard features of Google Workspace Apps. It’s great for filling in the gaps in your workflows.

With Apps Script, you can do cool stuff like automating repeatable tasks, creating documents, emailing people automatically and connecting your Google Sheets to other services you use.

Writing your first Google Script

In this Google Sheets script tutorial, we’re going to write a script that is bound to our Google Sheet. This is called a container-bound script.

(If you’re looking for more advanced examples and tutorials, check out the full list of Apps Script articles on my homepage.)

Hello World in Google Apps Script

Let’s write our first, extremely basic program, the classic “Hello world” program beloved of computer teaching departments the world over.

Begin by creating a new Google Sheet.

Then click the menu: Extensions > Apps Script

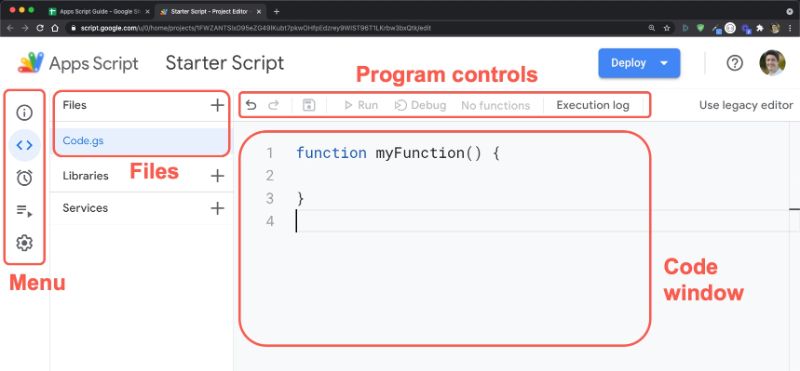
This will open a new tab in your browser, which is the Google Apps Script editor window:

Google Apps Script Editor

By default, it’ll open with a single Google Script file (code.gs) and a default code block, myFunction():

function myFunction() {
  
}

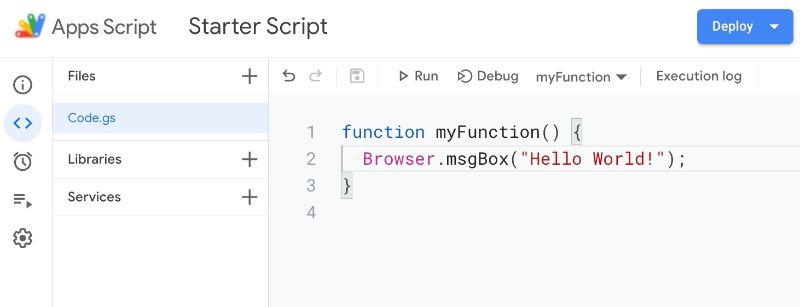
In the code window, between the curly braces after the function myFunction() syntax, write the following line of code so you have this in your code window:

function myFunction() {
  Browser.msgBox("Hello World!");
}

Your code window should now look like this:

Hello World Apps Script

Google Apps Script Authorization

Google Scripts have robust security protections to reduce risk from unverified apps, so we go through the authorization workflow when we first authorize our own apps.

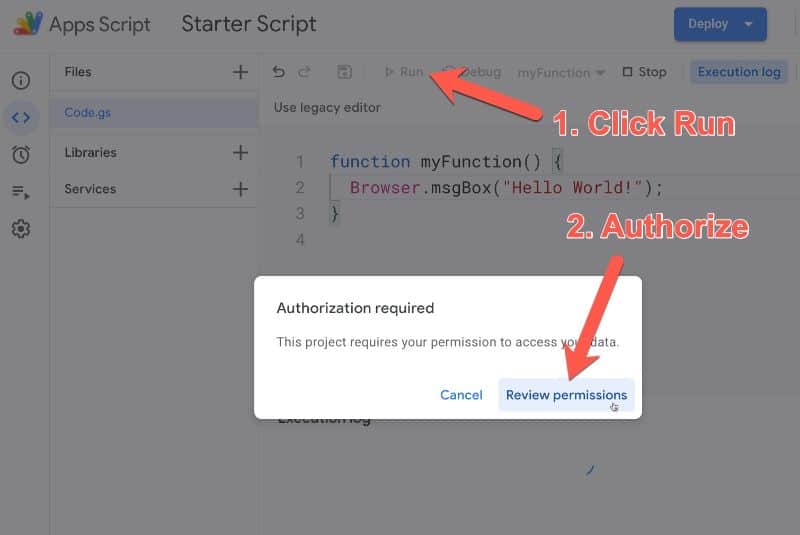
When you hit the run button for the first time, you will be prompted to authorize the app to run:

Google Apps Script Authorization

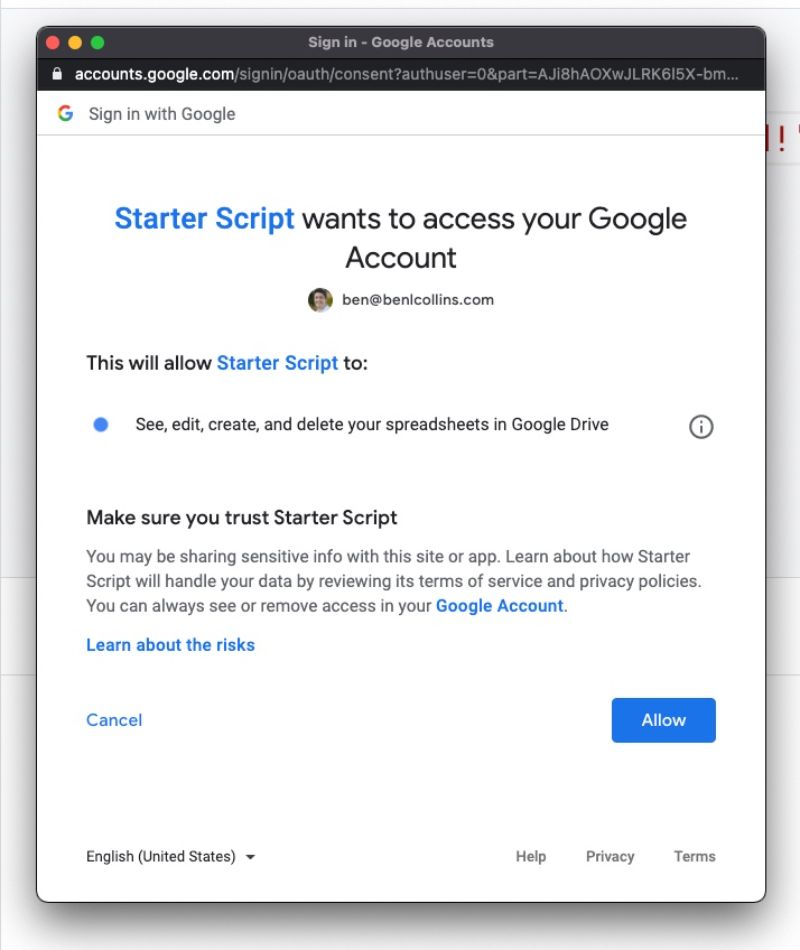
Clicking Review Permissions pops up another window in turn, showing what permissions your app needs to run. In this instance the app wants to view and manage your spreadsheets in Google Drive, so click Allow (otherwise your script won’t be able to interact with your spreadsheet or do anything):

Google Apps Script Access

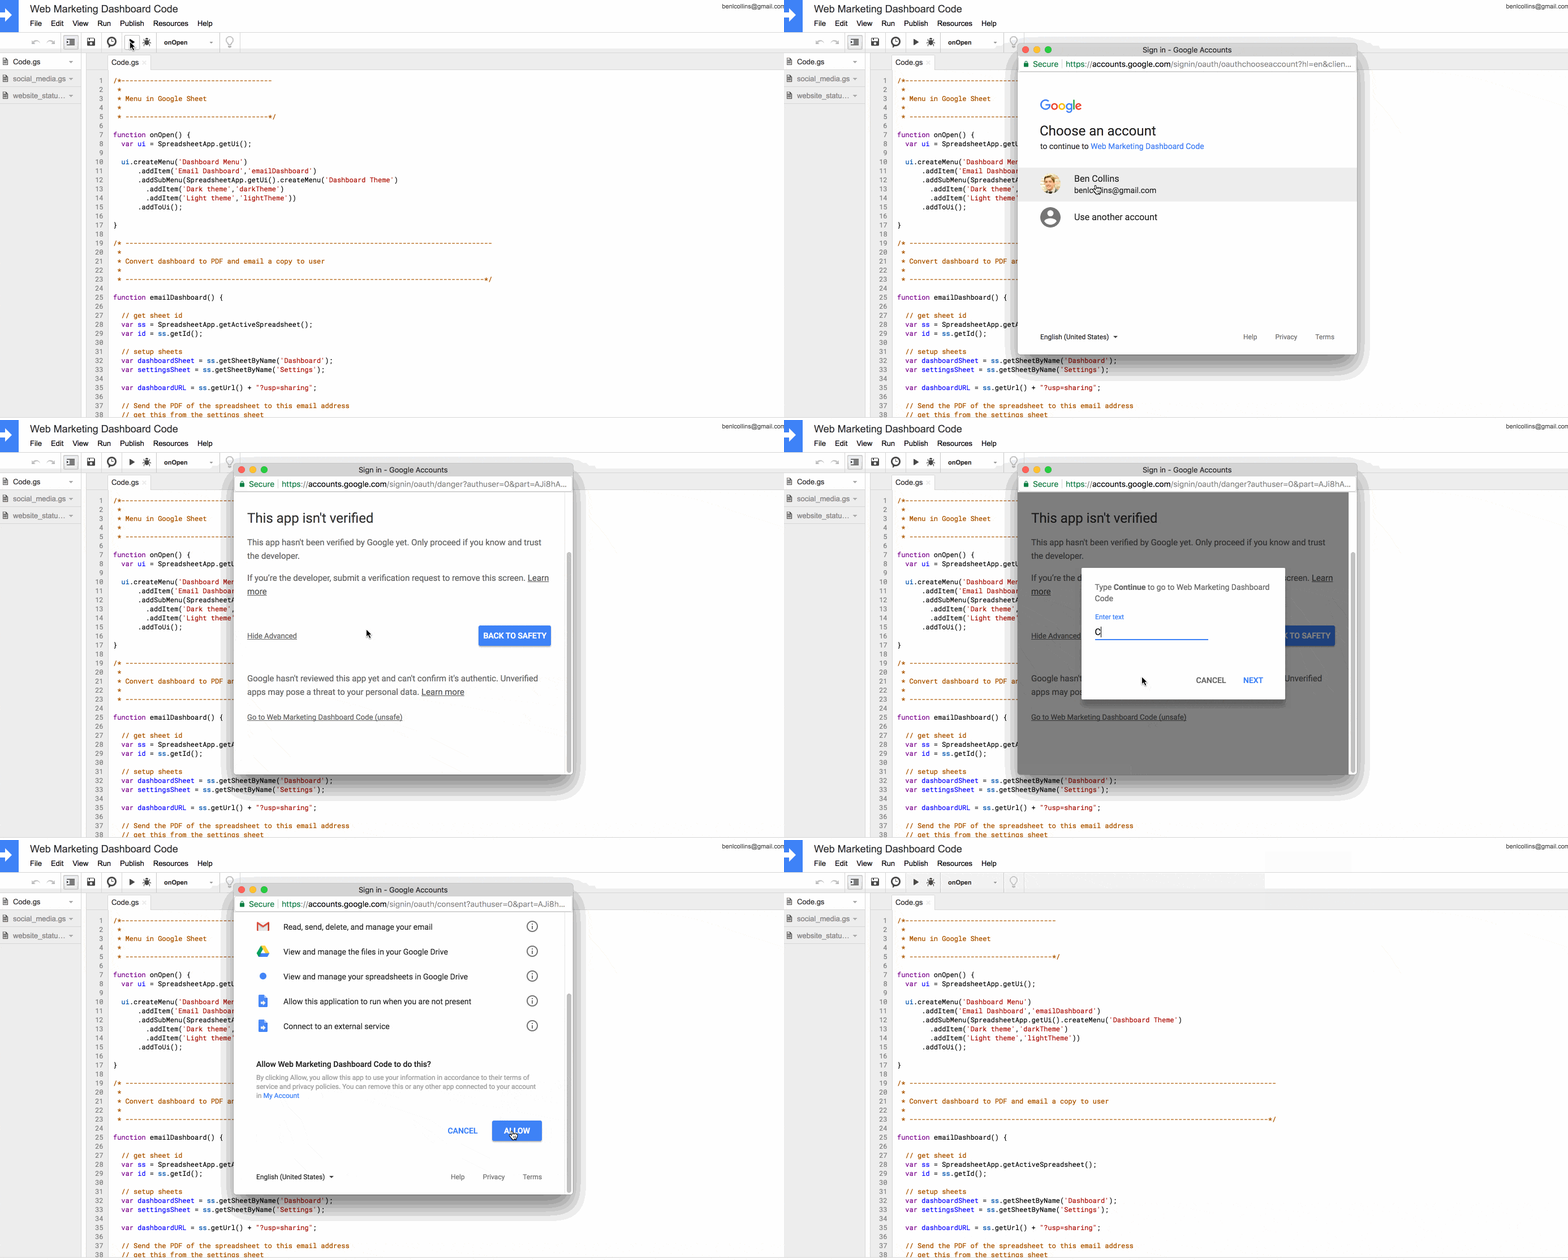
❗️When your first run your apps script, you may see the “app isn’t verified” screen and warnings about whether you want to continue.

In our case, since we are the creator of the app, we know it’s safe so we do want to continue. Furthermore, the apps script projects in this post are not intended to be published publicly for other users, so we don’t need to submit it to Google for review (although if you want to do that, here’s more information).

Click the “Advanced” button in the bottom left of the review permissions pop-up, and then click the “Go to Starter Script Code (unsafe)” at the bottom of the next screen to continue. Then type in the words “Continue” on the next screen, click Next, and finally review the permissions and click “ALLOW”, as shown in this image (showing a different script in the old editor):

More information can be found in this detailed blog post from Google Developer Expert Martin Hawksey.

Running a function in Apps Script

Once you’ve authorized the Google App script, the function will run (or execute).

If anything goes wrong with your code, this is the stage when you’d see a warning message (instead of the yellow message, you’ll get a red box with an error message in it).

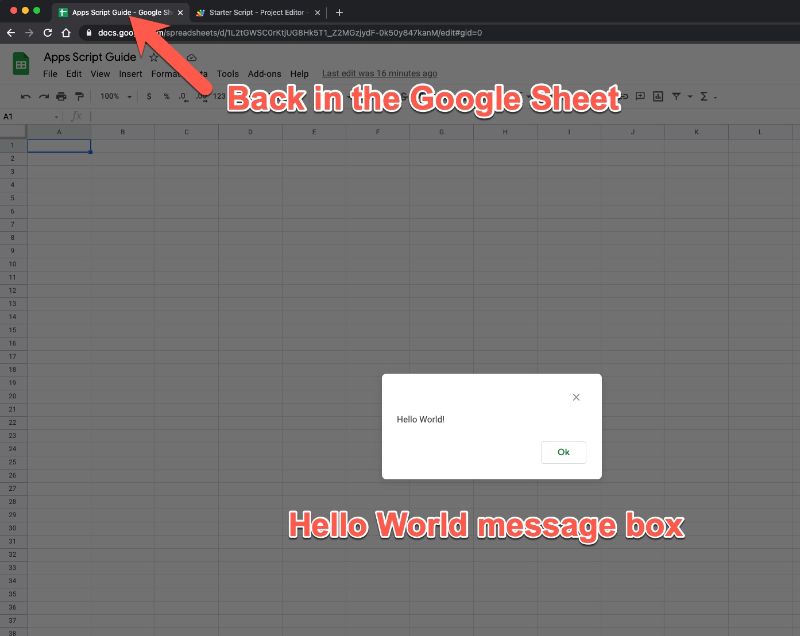
Return to your Google Sheet and you should see the output of your program, a message box popup with the classic “Hello world!” message:

Message Box Google Sheets

Click on Ok to dismiss.

Great job! You’ve now written your first apps script program.

Rename functions in Google Apps Script

We should rename our function to something more meaningful.

At present, it’s called myFunction which is the default, generic name generated by Google. Every time I want to call this function (i.e. run it to do something) I would write myFunction(). This isn’t very descriptive, so let’s rename it to helloWorld(), which gives us some context.

So change your code in line 1 from this:

function myFunction() {
  Browser.msgBox("Hello World!");
}

to this:

function helloWorld() {
  Browser.msgBox("Hello World!");
}

Note, it’s convention in Apps Script to use the CamelCase naming convention, starting with a lowercase letter. Hence, we name our function helloWorld, with a lowercase h at the start of hello and an uppercase W at the start of World.

Adding a custom menu in Google Apps Script

In its current form, our program is pretty useless for many reasons, not least because we can only run it from the script editor window and not from our spreadsheet.

Let’s fix that by adding a custom menu to the menu bar of our spreadsheet so a user can run the script within the spreadsheet without needing to open up the editor window.

This is actually surprisingly easy to do, requiring only a few lines of code. Add the following 6 lines of code into the editor window, above the helloWorld() function we created above, as shown here:

function onOpen() {
  const ui = SpreadsheetApp.getUi();
  ui.createMenu('My Custom Menu')
      .addItem('Say Hello', 'helloWorld')
      .addToUi();
}

function helloWorld() {
  Browser.msgBox("Hello World!");
}

If you look back at your spreadsheet tab in the browser now, nothing will have changed. You won’t have the custom menu there yet. We need to re-open our spreadsheet (refresh it) or run our onOpen() script first, for the menu to show up.

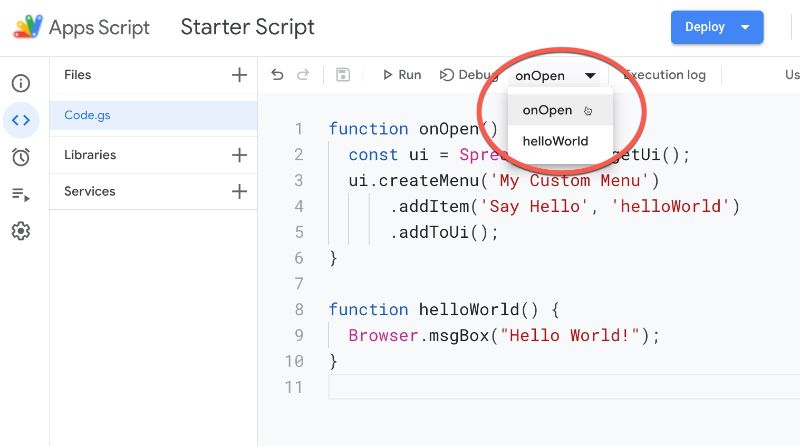
To run onOpen() from the editor window, first select then run the onOpen function as shown in this image:

Google Apps Script Function Menu

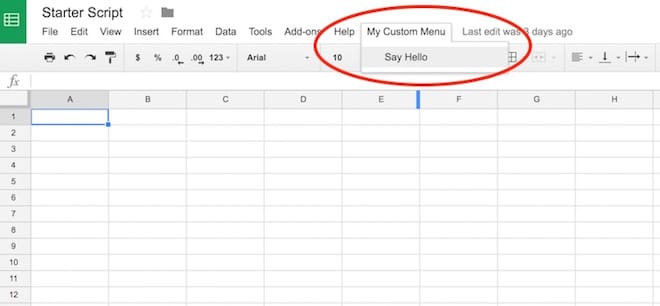
Now, when you return to your spreadsheet you’ll see a new menu on the right side of the Help option, called My Custom Menu. Click on it and it’ll open up to show a choice to run your Hello World program:

Custom menu

Run functions from buttons in Google Sheets

An alternative way to run Google Scripts from your Sheets is to bind the function to a button in your Sheet.

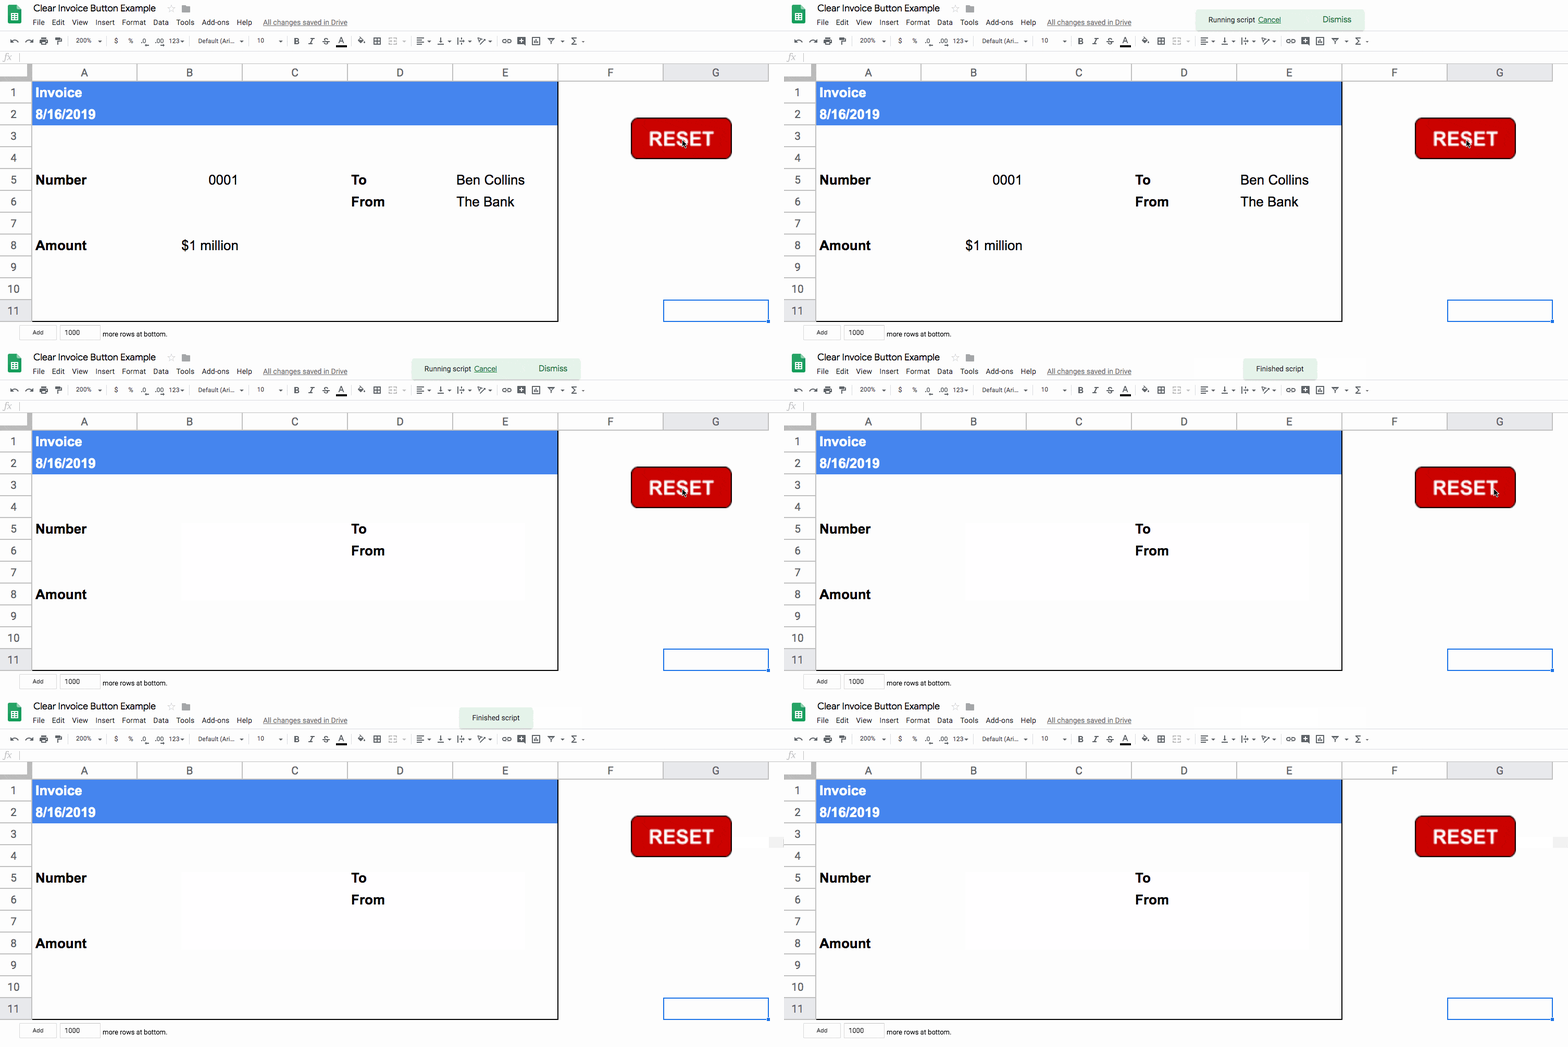
For example, here’s an invoice template Sheet with a RESET button to clear out the contents:

Button with apps script in google sheets

For more information on how to do this, have a look at this post: Add A Google Sheets Button To Run Scripts

Google Apps Script Examples

Macros in Google Sheets

Another great way to get started with Google Scripts is by using Macros. Macros are small programs in your Google Sheets that you record so that you can re-use them (for example applying standard formatting to a table). They use Apps Script under the hood so it’s a great way to get started.

Read more: The Complete Guide to Simple Automation using Google Sheets Macros

Custom function using Google Apps Script

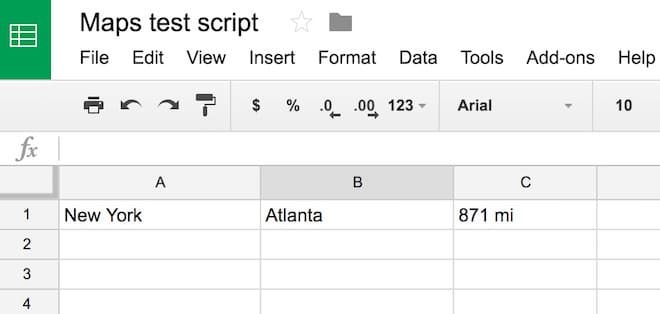
Let’s create a custom function with Apps Script, and also demonstrate the use of the Maps Service. We’ll be creating a small custom function that calculates the driving distance between two points, based on Google Maps Service driving estimates.

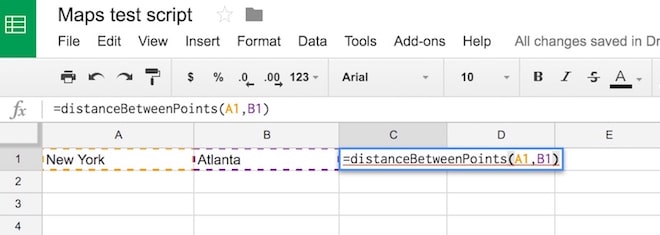
The goal is to be able to have two place-names in our spreadsheet, and type the new function in a new cell to get the distance, as follows:

GAS custom function for maps

The solution should be:

GAS custom map function output

Copy the following code into the Apps Script editor window and save. First time, you’ll need to run the script once from the editor window and click “Allow” to ensure the script can interact with your spreadsheet.

function distanceBetweenPoints(start_point, end_point) {
  // get the directions
  const directions = Maps.newDirectionFinder()
     .setOrigin(start_point)
     .setDestination(end_point)
     .setMode(Maps.DirectionFinder.Mode.DRIVING)
     .getDirections();
  
  // get the first route and return the distance
  const route = directions.routes[0];
  const distance = route.legs[0].distance.text;
  return distance;
}

Saving data with Google Apps Script

Let’s take a look at another simple use case for this Google Sheets Apps Script tutorial.

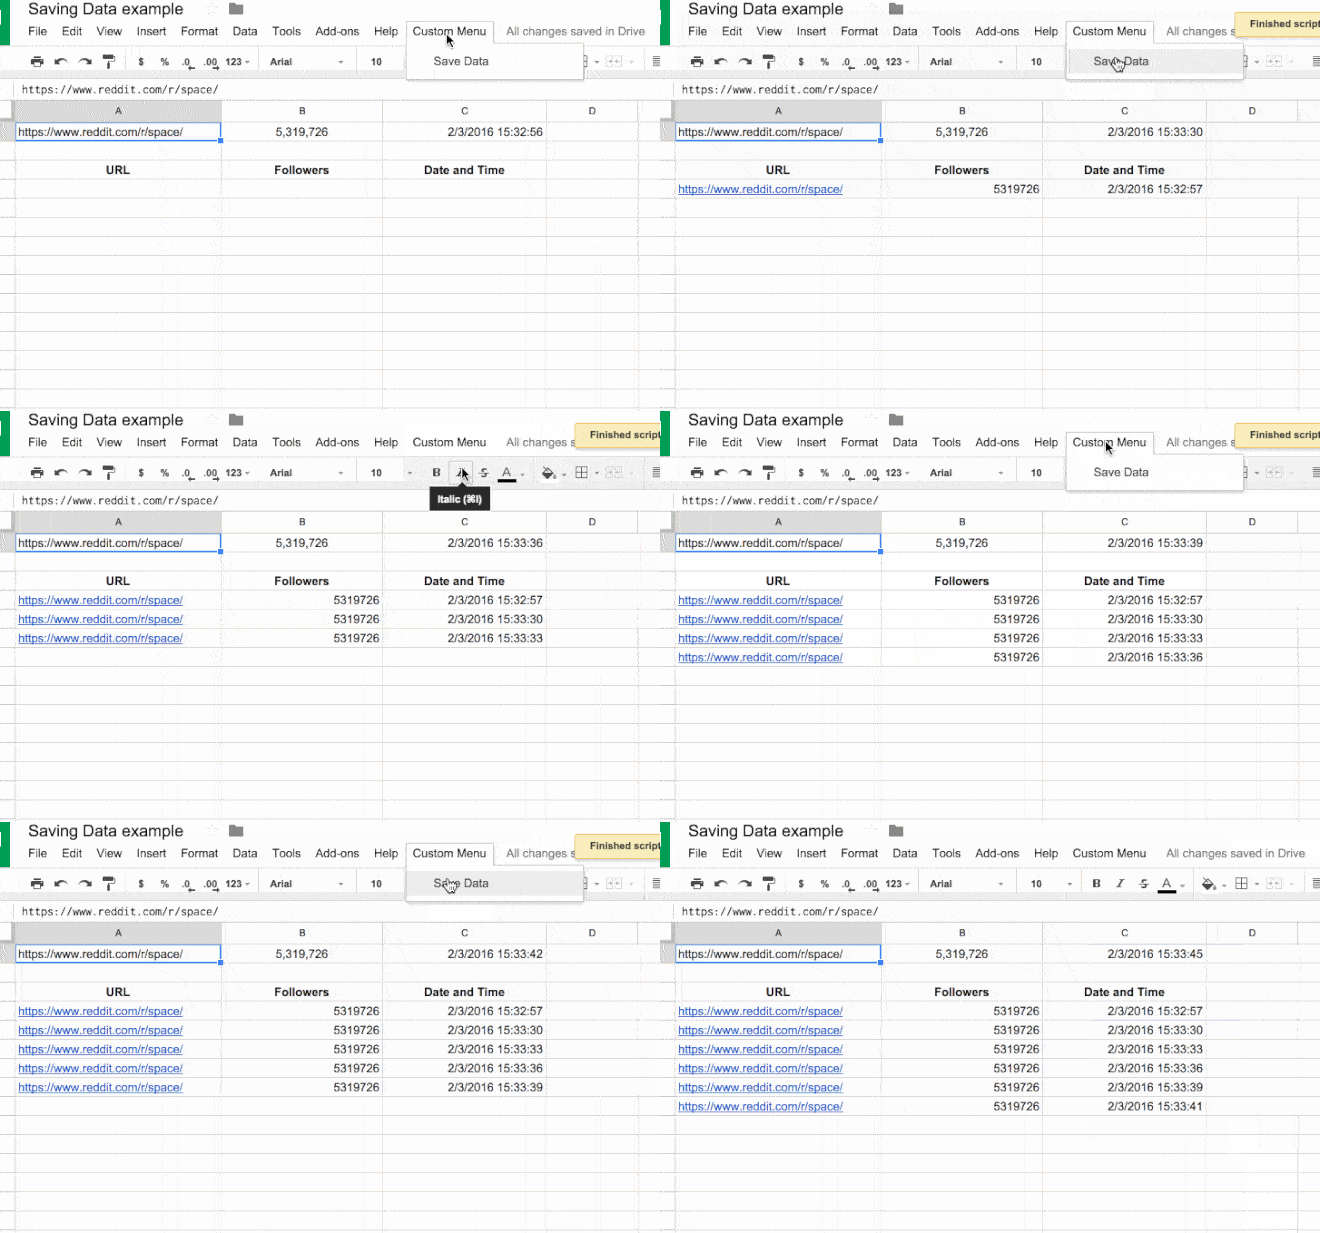
Suppose I want to save copy of some data at periodic intervals, like so:

save data in google sheet

In this script, I’ve created a custom menu to run my main function. The main function, saveData(), copies the top row of my spreadsheet (the live data) and pastes it to the next blank line below my current data range with the new timestamp, thereby “saving” a snapshot in time.

The code for this example is:

// custom menu function
function onOpen() {
  const ui = SpreadsheetApp.getUi();
  ui.createMenu('Custom Menu')
      .addItem('Save Data','saveData')
      .addToUi();
}

// function to save data
function saveData() {
  const ss = SpreadsheetApp.getActiveSpreadsheet();
  const sheet = ss.getSheets()[0];
  const url = sheet.getRange('Sheet1!A1').getValue();
  const follower_count = sheet.getRange('Sheet1!B1').getValue();
  const date = sheet.getRange('Sheet1!C1').getValue();
  sheet.appendRow([url,follower_count,date]);
}

See this post: How To Save Data In Google Sheets With Timestamps Using Apps Script, for a step-by-step guide to create and run this script.

Google Apps Script example in Google Docs

Google Apps Script is by no means confined to Sheets only and can be accessed from other Google Workspace tools.

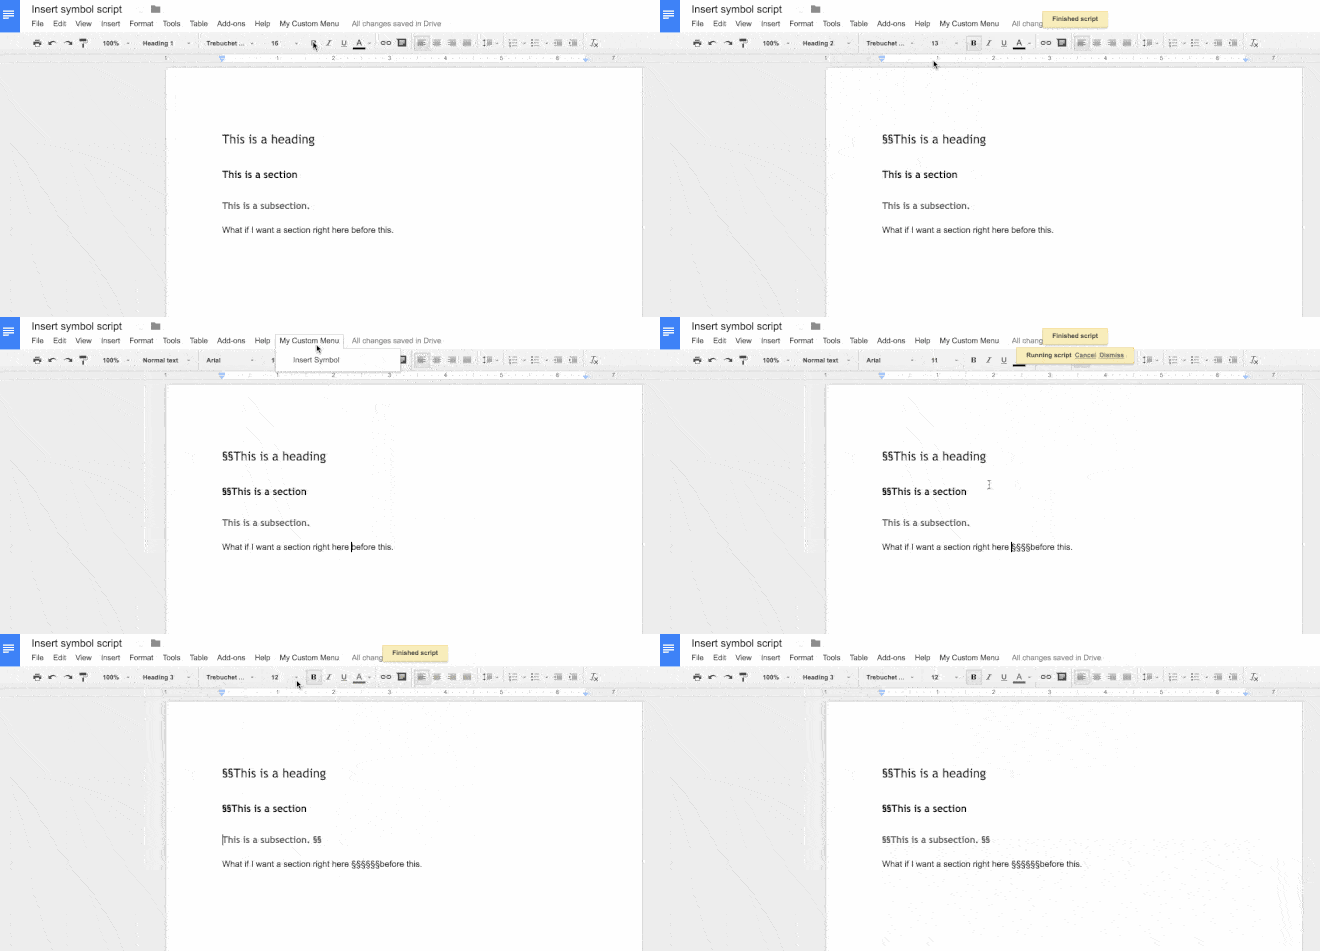
Here’s a quick example in Google Docs, showing a script that inserts a specific symbol wherever your cursor is:

Google Docs Apps Script

We do this using Google App Scripts as follows:

1. Create a new Google Doc

2. Open script editor from the menu: Extensions > Apps Script

3. In the newly opened Script tab, remove all of the boilerplate code (the “myFunction” code block)

4. Copy in the following code:

// code to add the custom menu
function onOpen() {
  const ui = DocumentApp.getUi();
  ui.createMenu('My Custom Menu')
      .addItem('Insert Symbol', 'insertSymbol')
      .addToUi();
}

// code to insert the symbol
function insertSymbol() {  
  // add symbol at the cursor position
  const cursor = DocumentApp.getActiveDocument().getCursor();
  cursor.insertText('§§');
  
}

5. You can change the special character in this line

cursor.insertText('§§');

to whatever you want it to be, e.g.

cursor.insertText('( ͡° ͜ʖ ͡°)');

6. Click Save and give your script project a name (doesn’t affect the running so call it what you want e.g. Insert Symbol)

7. Run the script for the first time by clicking on the menu: Run > onOpen

8. Google will recognize the script is not yet authorized and ask you if you want to continue. Click Continue

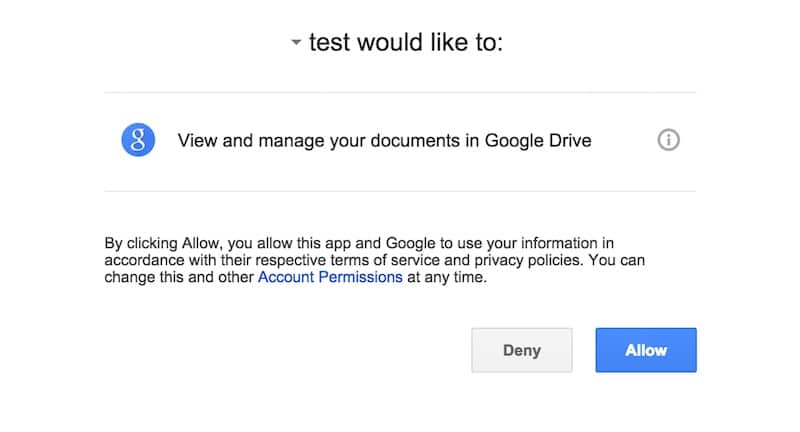
9. Since this the first run of the script, Google Docs asks you to authorize the script (I called my script “test” which you can see below):

Docs Apps Script Auth

10. Click Allow

11. Return to your Google Doc now.

12. You’ll have a new menu option, so click on it:

My Custom Menu > Insert Symbol

13. Click on Insert Symbol and you should see the symbol inserted wherever your cursor is.

Google Apps Script Tip: Use the Logger class

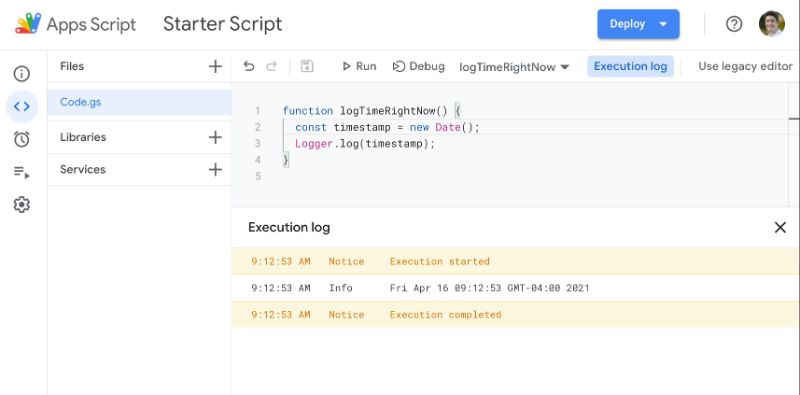
Use the Logger class to output text messages to the log files, to help debug code.

The log files are shown automatically after the program has finished running, or by going to the Executions menu in the left sidebar menu options (the fourth symbol, under the clock symbol).

The syntax in its most basic form is Logger.log(something in here). This records the value(s) of variable(s) at different steps of your program.

For example, add this script to a code file your editor window:

function logTimeRightNow() {
  const timestamp = new Date();
  Logger.log(timestamp);
}

Run the script in the editor window and you should see:

Google Apps Script Execution Logs

Real world examples from my own work

I’ve only scratched the surface of what’s possible using G.A.S. to extend the Google Apps experience.

Here are a couple of interesting projects I’ve worked on:

1) A Sheets/web-app consisting of a custom web form that feeds data into a Google Sheet (including uploading images to Drive and showing thumbnails in the spreadsheet), then creates a PDF copy of the data in the spreadsheet and automatically emails it to the users. And with all the data in a master Google Sheet, it’s possible to perform data analysis, build dashboards showing data in real-time and share/collaborate with other users.

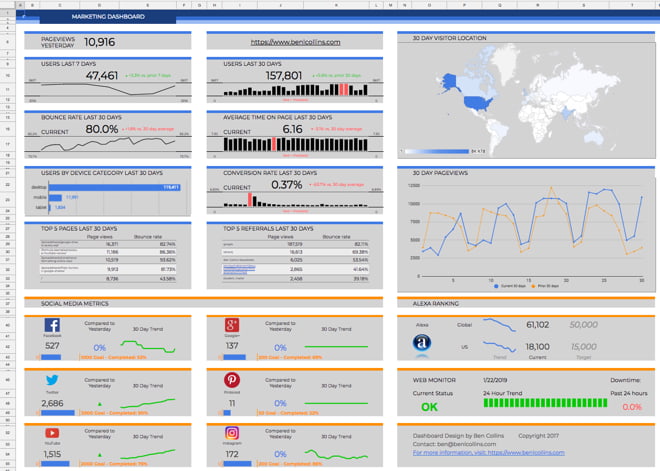
2) A dashboard that connects to a Google Analytics account, pulls in social media data, checks the website status and emails a summary screenshot as a PDF at the end of each day.

Marketing dashboard using Google Apps Script

3) A marking template that can send scores/feedback to students via email and Slack, with a single click from within Google Sheets. Read more in this article: Save time with this custom Google Sheets, Slack & Email integration

My own journey into Google Apps Script

My friend Julian, from Measure School, interviewed me in May 2017 about my journey into Apps Script and my thoughts on getting started:

Google Apps Script Resources

For further reading, I’ve created this list of resources for information and inspiration:

Course

Documentation

Official Google Documentation

Google Workspace Developers Blog

Communities

Google Apps Script Group

Stack Overflow GAS questions

Elsewhere On The Internet

A huge big up-to-date list of Apps Script resources hosted on GitHub.

For general Javascript questions, I recommend this JavaScript tutorial page from W3 Schools when you’re starting out.

When you’re more comfortable with Javascript basics, then I recommend the comprehensive JavaScript documentation from Mozilla.

Imagination and patience to learn are the only limits to what you can do and where you can go with GAS. I hope you feel inspired to try extending your Sheets and Docs and automate those boring, repetitive tasks!

Related Articles

Dashboard Design Checklist: From a Blank Google Sheet to Business Insights

Dashboard design is hard.

You start with a blank canvas, or a blank Google Sheet in this case, and you have to somehow turn that into business insights, which will grow your bottom line, make your organization more efficient or help you understand your customers better.

Dashboard design process
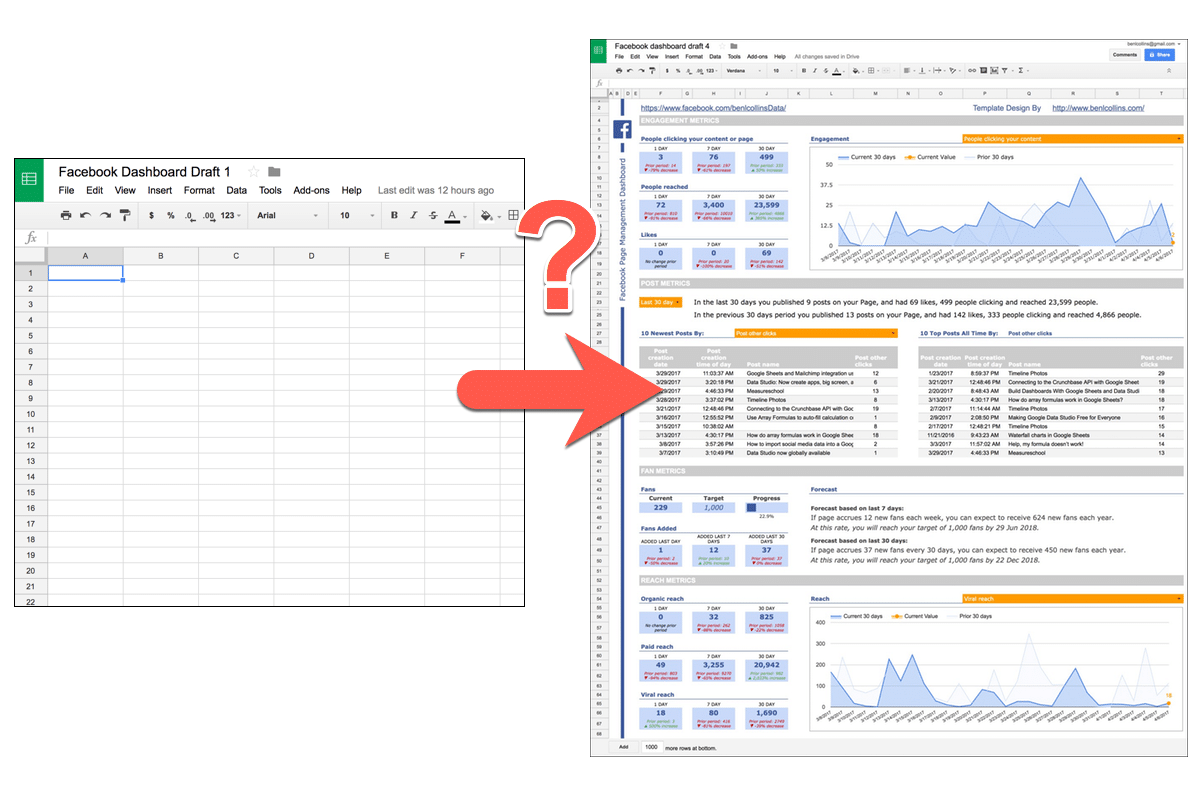
Notice the blank sheet is Draft 1 and the final dashboard is Draft 4. It’s an iterative process. Click to open larger image in new browser tab.

The blank screen stares back at you, waiting for you to do something.

It feels overwhelming.

You clasp your hands around the back of your head, lean back in your chair and rue the day you mentioned building a dashboard to your boss.

It was supposed to be easy. Easy to create a masterpiece, a thing of beauty to wow your team.

Meanwhile, that blank Sheet continues to stare back at you, emptier than ever.

Dashboard design starts with a blank Google Sheet

Continue reading Dashboard Design Checklist: From a Blank Google Sheet to Business Insights