In the following image, I have two browser windows open. On the left, a Google Sheet containing a simple table of data. In the right browser window, a web page with a d3 chart that displays the data from the Google Sheet and can be refreshed dynamically when the data changes.
Why use Google Sheets as a data store?
– it’s super convenient, because you can see and play with your data.
– you can leverage Google Apps Script to build your web app and host everything, including the d3 chart web page, on Google’s servers for free.
– it’s fun!
How is this built?
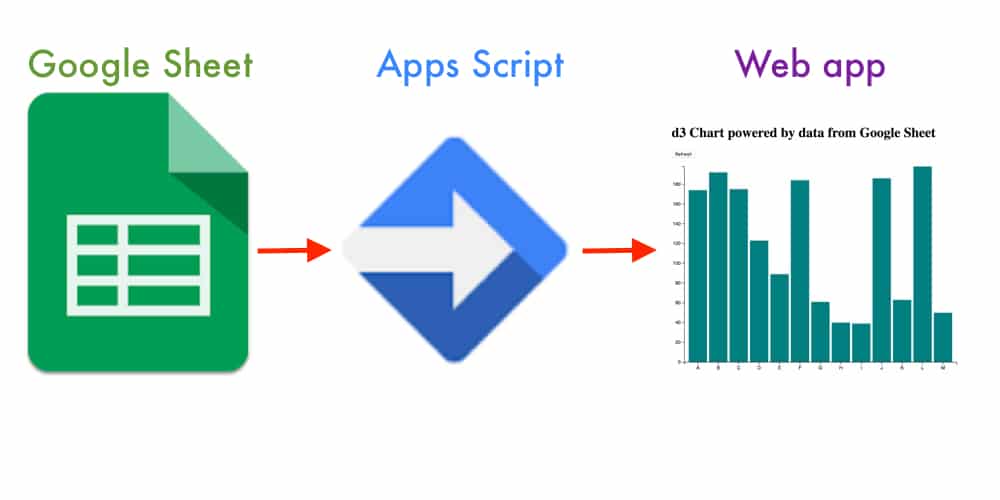
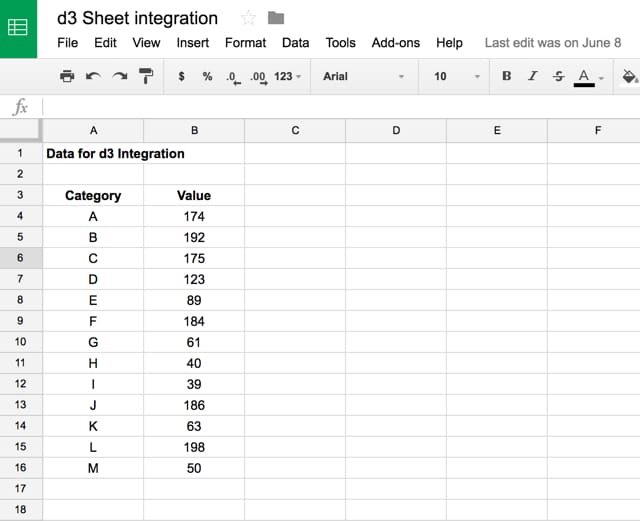
It starts with the Google Sheet that stores our data. That part is easy and self-explanatory.
Next comes some Apps Script code (for a primer, check out this starter article) that does several things:
– collect the data from the Google Sheet
– serves up a basic web app (hosted on Google’s servers) called an HTML Service App
– passes the data from the Sheet to this web app
Finally, on the front-end:
– the app uses the Javascript library d3 to create a chart of this data
– the app has a “Refresh” button to pull in new data.
Note all of this code lives in the container-bound Apps Script project attached to the Google Sheet.
Steps
1. Create a new Google Sheet and add some data:
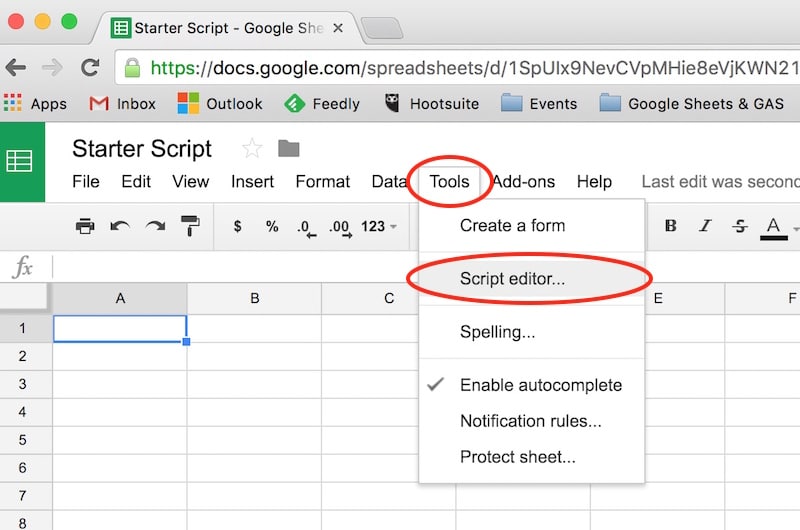
2. Open up the script editor and create the following files in the Apps Script project:
code.gs

index.html

styles.css.html

main.js.html

chart.js.html
3. Copy and paste the code from Github for each of these files:
code.gs
index.html
styles.css.html
main.js.html
chart.js.html
4. Publish the app to the web
The last step is to publish as a web app, and grant permission for the app to access your Google Sheet.
Then you should have a dynamic d3 chart based on data from your Google Sheet:
Diving into the code in more detail
Firstly we need to get the data out of our Google Sheet. This function achieves that:
// get the chart data to pass through to front-end
function getChartData() {

  var ss = SpreadsheetApp.openById("XXXXXXXXXXXXXXX");
  var sheet = ss.getActiveSheet();

  var headings = sheet.getRange(3,1,1,sheet.getLastColumn()).getValues()[0].map(function(heading) {
    return heading.toLowerCase();
  });

  var values = sheet.getRange(4, 1, sheet.getLastRow()-3, sheet.getLastColumn()).getValues();

  var data = [];
  for (var i=0; i < values.length; i++) {
    var obj = {};
    for (var j = 0; j < values[i].length; j++) {
      obj[headings[j]] = values[i][j];
    }
    data.push(obj);
  }

  return data;
}
The XXXXXXXXX reference will need to be swapped out to the ID of your spreadsheet (find that in the URL).
This script gets the headings and an array of the values from the Google Sheet, using the getRange method. Then a nested loop pushes the headings/values into objects and into an array.
This array is returned by the function, and looks like this:
[{category=A, value=174.0}, {category=B, value=192.0}, {category=C, value=175.0}, {category=D, value=123.0}, {category=E, value=89.0}, {category=F, value=184.0}, {category=G, value=61.0}, {category=H, value=40.0}, {category=I, value=39.0}, {category=J, value=186.0}, {category=K, value=63.0}, {category=L, value=198.0}, {category=M, value=50.0}]
Create a web app hosted by Google
You need this function in your code.gs file:
function doGet(e) {
  return HtmlService.createTemplateFromFile("index.html")
    .evaluate()
    .setSandboxMode(HtmlService.SandboxMode.IFRAME);
}
and the index.html file, which is what gets published as the web app.
<!DOCTYPE html>
<!-- styles -->
<?!= HtmlService.createHtmlOutputFromFile("styles.css").getContent(); ?>

<div class="content">

  <h2>d3 chart powered by data from Google Sheet</h2>

  <input class="button" type="submit" value="Refresh" id="refresh"><br>

  <svg class="chart"></svg>

</div>

<!-- javascript -->
<script src="//d3js.org/d3.v3.min.js"></script>
<?!= HtmlService.createHtmlOutputFromFile("chart.js").getContent() ?>
<?!= HtmlService.createHtmlOutputFromFile("main.js").getContent() ?>
In this file, I’ve added a heading, a refresh button and the svg element for the d3 chart. At the bottom of the file, the d3 javascript library is loaded, along with my two javascript files chart.js and main.js.
Add client side javascript to the web app
This code goes inside the script tags:
// start by getting the data
window.onload = function() {

  google.script.run
    .withSuccessHandler(drawChart)
    .getChartData();

};
This file is loaded when the index file is loaded.
google.script.run calls the server side Apps Script function getChartData (to get the data from the Google Sheet) and, if successful, passes that data to the drawChart function.
Use d3 to create the chart
This file, chart.js.html, is loaded with the index.html page:
// function to create the bar chart
var drawChart = function (data) {

   // full d3 code in here

};
For the full code, see the repo here on Github.
I also added some basic styling from the styles.css.html file.
Further reading
This fantastic book, Interactive Data Visualization for the Web, from Scott Murray is a great place to start learning d3.
Great post. Really helpful.
It would probably help to add “triggers” to the explanation
doGet -> From Spreadsheet -> On Edit
getChartData -> From Spreadsheet -> On Edit
Thanks Byron and a great suggestion!
Great job!! Do you know how to plot two data columns?
I’ve tried and failed…
It’s good practice to use flexible, dynamic coordinates, heights, widths, x values, and y values so your visualization can scale appropriately along with your data.
Thanks for this insightful walkthrough Ben! Very helpful in getting me off the ground in setting up some custom charts from google sheets.
I wasn’t aware of the ability to get a web app up and running through the editor, real cool.
Hi: Great example, got almost all the way through. Alas only drew one bar.
Is there a link to a community?
Probably the best place to ask D3 questions is Stack Overflow d3 community: https://stackoverflow.com/questions/tagged/d3.js?mixed=1
Thanks Ben. How would this code change if using chart.js instead?
TypeError: Cannot find function toLowerCase in object 5. (line 7, file “1”)
How to fix
I replaced getActiveSheet() with var sheet = ss.getSheetByName(“SheetName”); to try to get a particular sheet in a spreadsheet.
This doesn’t work, any other way to get data from a particular sheet? This particular sheet has a pivot table.
so the gid= “XXXX” you need to grab those for the sheet id, i am trying to just grab the spreadsheet but the code is not working at all trying to figure the rest out since i am new to Javascript.
Can this chart automatically refresh on a timed interval rather than when the refresh button is pressed, or refresh when data is updated.
If so what needs to be changed in the code for it to work this way.