Best wishes to you all for 2019!
This is one of my favorite posts of the year to write, because it’s my chance to reflect and look back at the whole year, and celebrate the wins and learn from my mistakes. It’s a chance to assess growth (both for the business and personally) and think about where I want to go in 2019.
2018 was extremely rewarding, but also extremely challenging at times.
Life and business are both moving forwards again and I go into 2019 full of optimism.
Starting with the highlights:
2018 highlights
Online courses
- This year I created and launched three new courses:
- In terms of the overall school metrics, The Collins School of Data continues to grow and has now seen over 9,000 students enroll in a course. (Thank you! 🙏)
Website
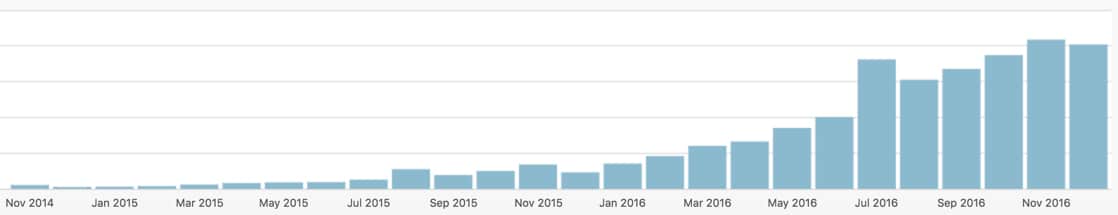
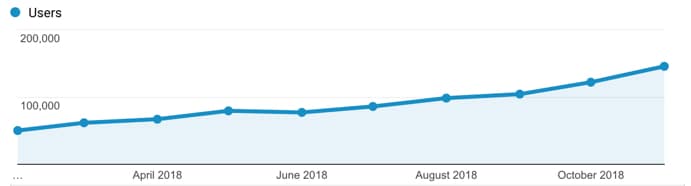
- Continued growth of this website, benlcollins.com, which now sees over 200k pageviews/month and 125k users/month, and will reach around 1.7 million pageviews for the year 🤯
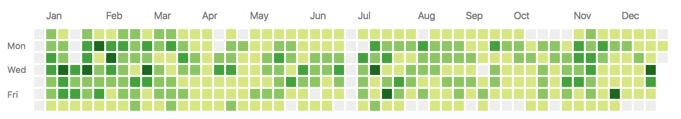
- What’s been really pleasing has been to see it grow over the course of the year:
- I published 22 pieces of new content on the site, which is less than previous years but there were some long posts among them. I was proud of the content I published this year, particularly these three posts:
- Slow Google Sheets? 🐢 Here are 27 ideas to try today
- Pivot Tables 101: A Beginner’s Guide
- The complete guide to simple automation in Google Sheets, using Macros
- I finally filled a glaring gap in my tutorials by creating a comprehensive Beginner Guide to Google Sheets
- The social media statistics article, about how to import social media stats into Google Sheets with IMPORT formulas, continues to have a lively debate in the comments section, with nearly 300 comments and counting. This has been super fun to see.
- I also wrote about how we manage our family finances with Google Sheets
Conferences
- I attended the Craft and Commerce Conference in Boise, Idaho in June 2018. I met some interesting folks and picked up some super relevant knowledge from Mariah Coz‘s workshop on course launches
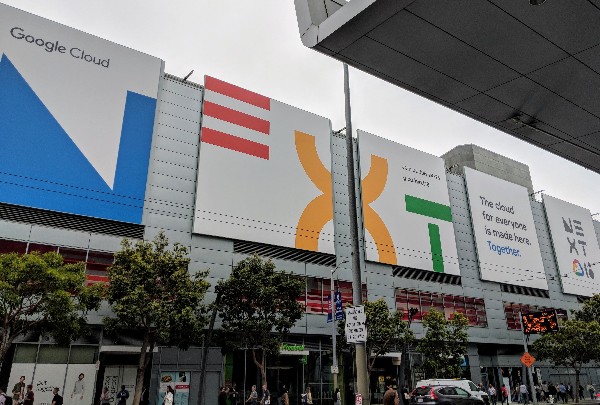
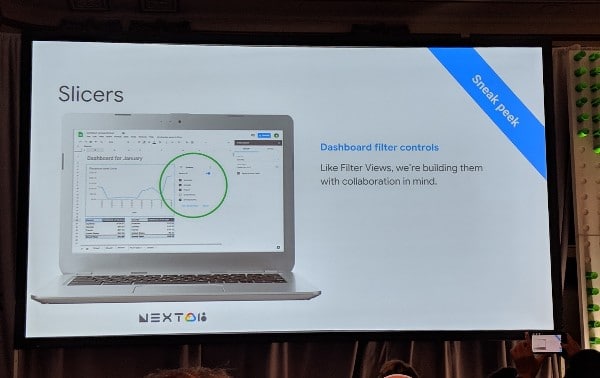
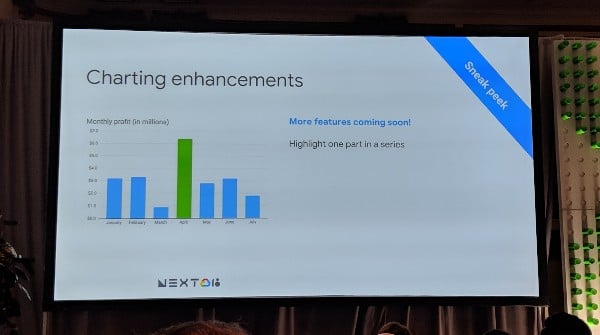
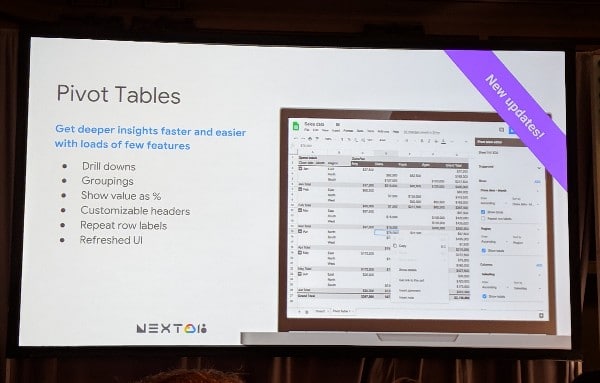
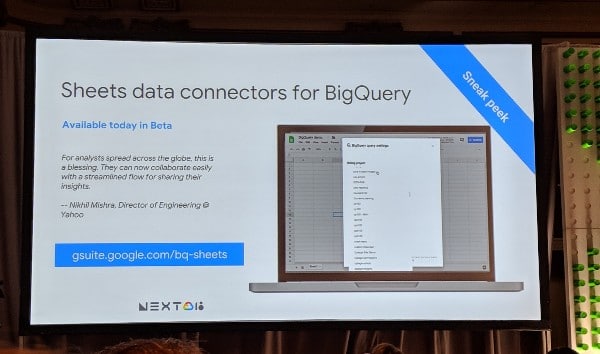
- I attended the Google Next 18 Conference in San Francisco in July 2018. I finally got to meet a whole bunch of folks I’ve been chatting with online for years, in person, which was great. The Google Sheets product team announced lots of cool new features coming to Google Sheets (some of which are now live, like the 5 million cell limit)
Investing in Design in 2018
I found a talented designer on peopleperhour.com to create some new course logos for my online courses:
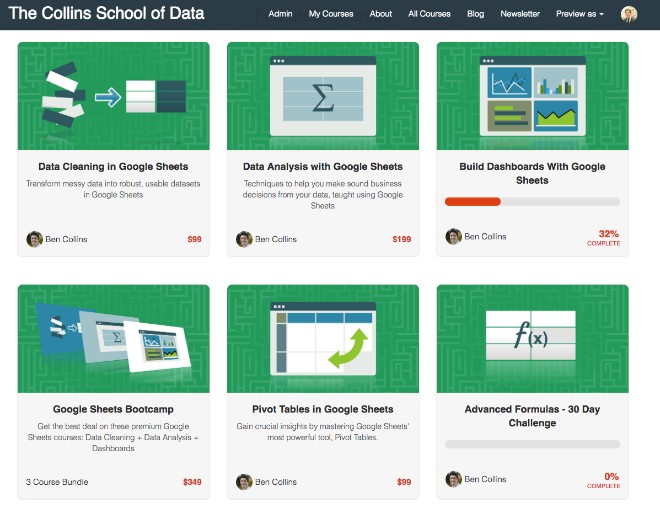
Compare that to the old course logos:
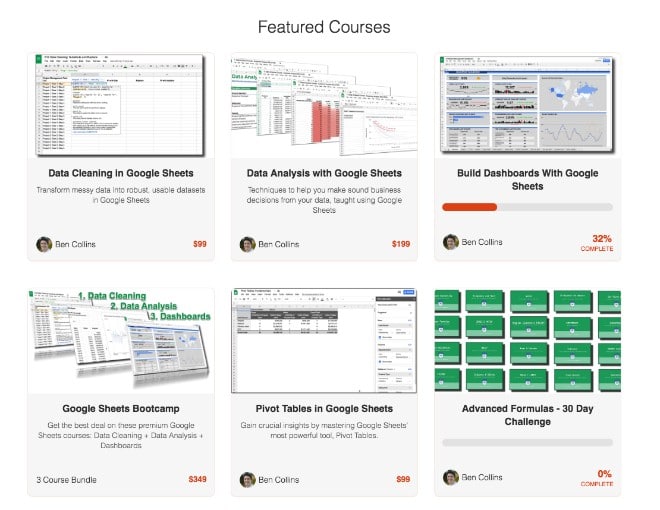
Worth every penny! I was really pleased with how they turned out and they’re so much stronger visually than the old screenshot logos I was using initially.
This is definitely something I want to continue to invest in this coming year.
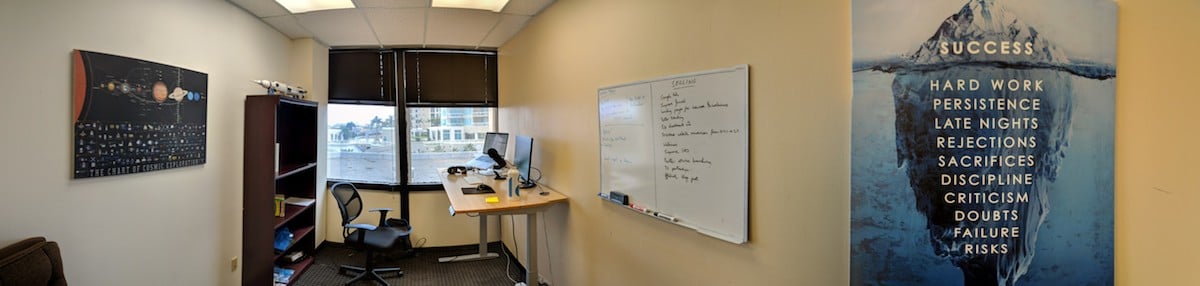
Stamping my personality on the office
I invested a little bit of time and money to make the office more personal, so it was somewhere I’d want to spend time and feel inspired when I was there.
I hung a few pictures on the walls and built a LEGO Saturn V rocket model to go on top of the bookcase (can you spot it?):
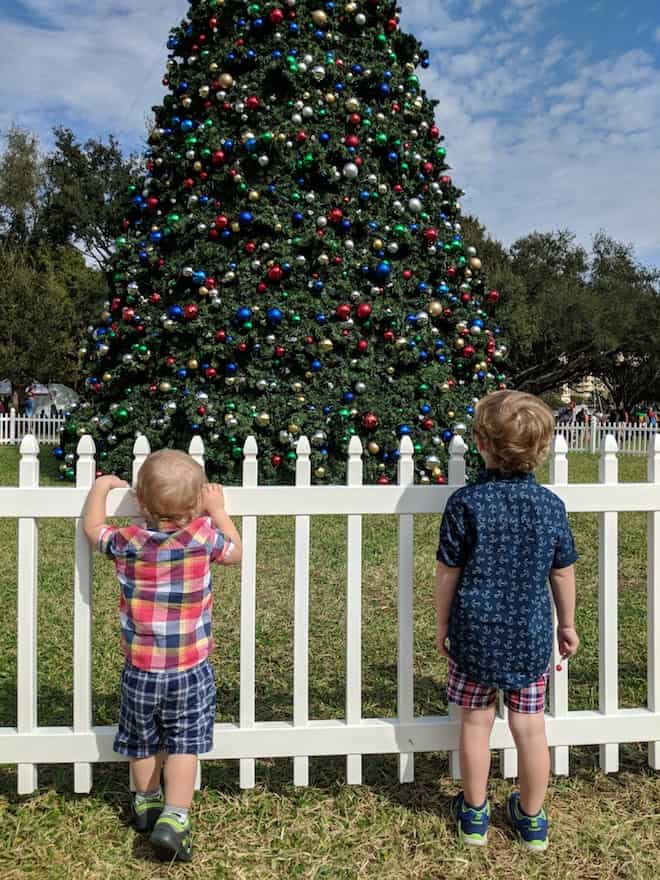
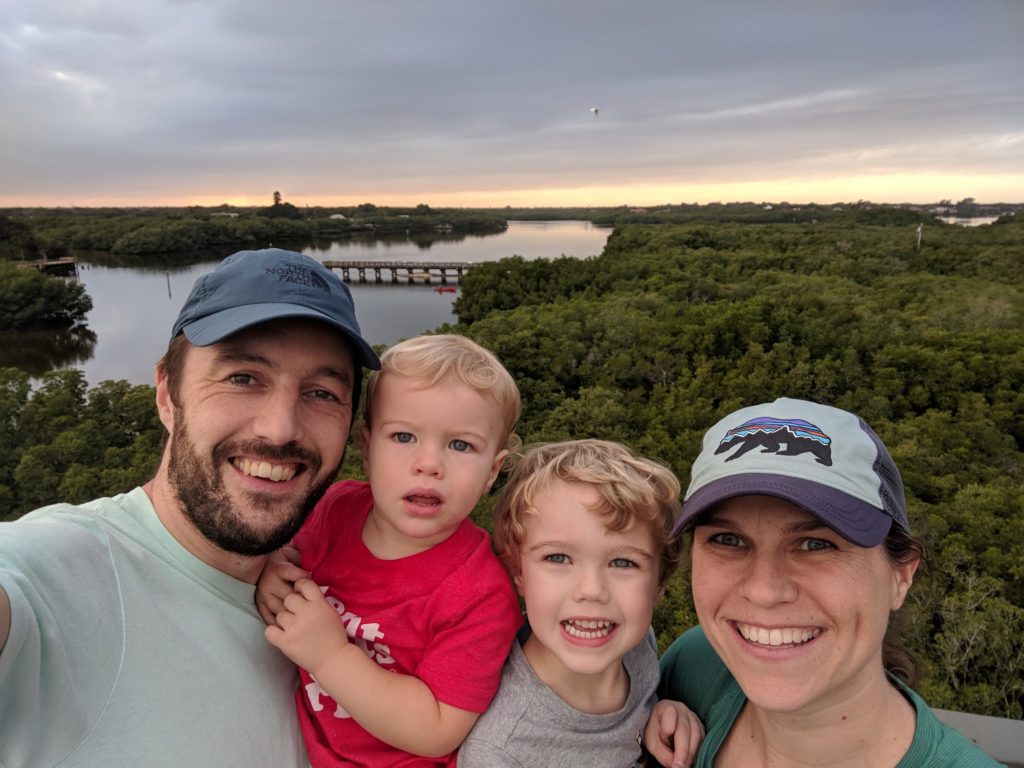
Saving the best for last, non-work highlights included:
- Watching my boys grow! It’s the most rewarding and challenging thing I’ve ever done
- A week hiking in Tasmania with my brother way back in January
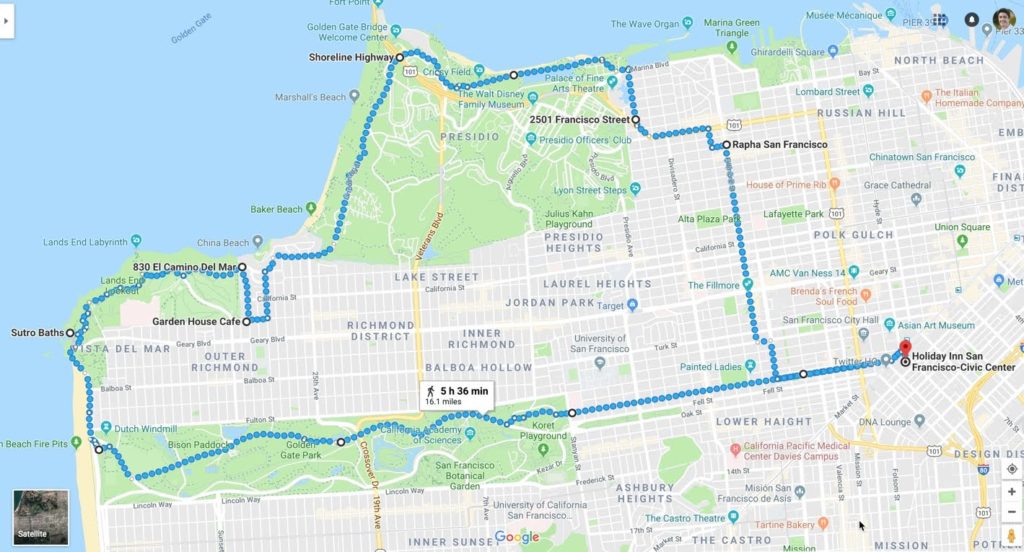
- A bonus weekend hanging out and hiking in San Francisco with my brother when the Google and Microsoft conferences happened in adjacent weeks. We did a fantastic 16-mile hike around San Fran:
- A weekend hiking in Boulder, Colorado with my wife Lexi. We both felt super energized and happy after a weekend of hiking in the mountains. I absolutely love it out there!
- Getting back to a semi-regular running schedule since September, after a health scare earlier in the year (see below). Still far short of where I want to be, but I’m making forward progress again.
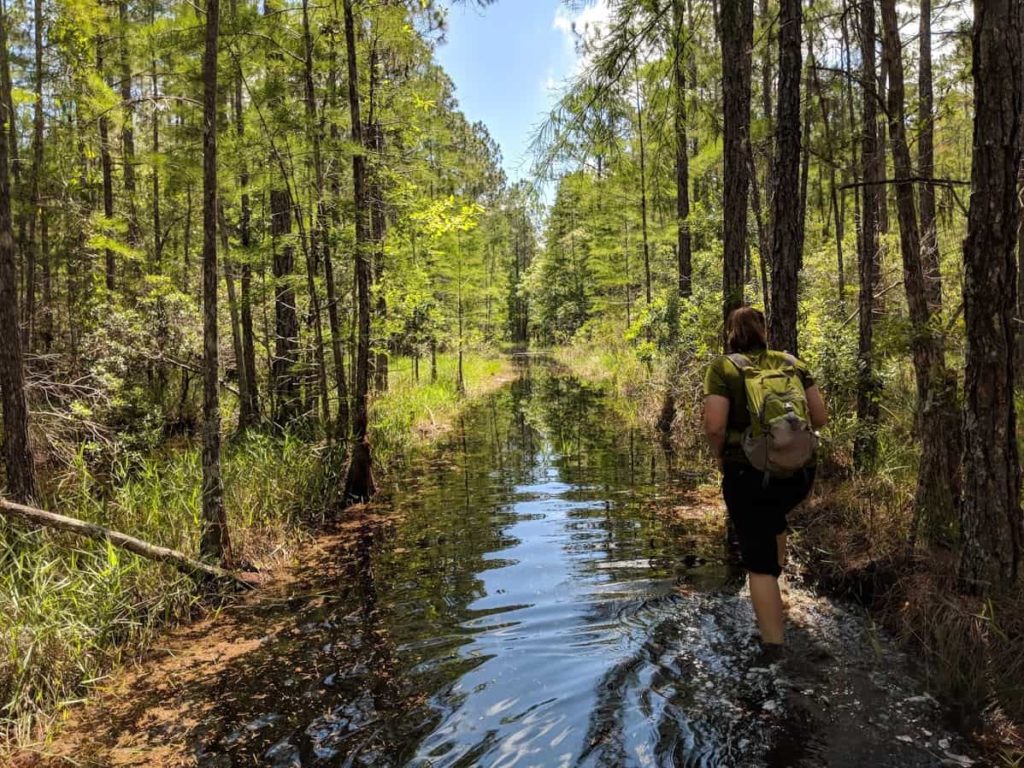
- The crazy walk we did at Brooker Creek Preserve, where almost the entire 5 mile trail was between ankle and knee deep under water!
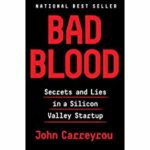
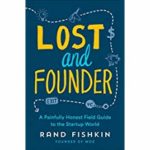
- I read 20 books this year, which is my highest tally since having children. I attribute some of that to the increased amount of time spent convalescing when I was sick. Highlights this year included:
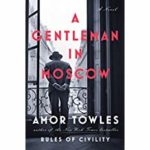 A Gentleman in Moscow – Amor Towles
An absolutely fantastic read about a Russian Count under house arrest in a Moscow hotel
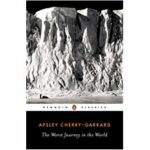 The Worst Journey in the World – Apsley Cherry-Gerrard
A classic tale of hardship and true adventure (my second read through)
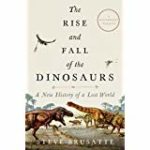 The Rise and Fall of the Dinosaurs – Steve Brusette
An eminently readable romp through the world of dinosaurs and paleontologists
Challenges in 2018
So 2018 was not without its challenges.
I had pneumonia earlier in the year that took forever to kick, and made for some nervous months and LOTS of doctor visits. I was basically sick, to varying degrees, most of the days between March and June. I got sick again in September but since then I’ve felt (mostly) back to normal (whatever that is).
Being a two working-parent household doesn’t get any easier (well, it has a little bit since both boys are sleeping through the night). My wife and I are both ambitious and love our work, but balancing being a good dad, a good husband and working hard on my business is still super hard. You end up always feeling like you’re not doing a good enough job at any of them, and it’s mentally exhausting.
I missed some of my targets this year. I didn’t hit my overall course revenue goal (I got close), but being sick for so long meant I launched one less course than I’d planned. That’s life though! Can’t make any excuses, just got to keep working hard and do better in 2019.
Looking forwards to 2019
My goals for 2019:
- Create a follow-up Apps Script course to the free Apps Script Blastoff! course I launched in December. I plan to launch this new course in March 2019
- Create two other courses. The shortlist at the moment includes: 1) “Beyond Sheets” on what to do when your data outgrows Google Sheets, 2) Regular Expressions in Google Sheets, 3) a Data Studio course, and 4) Google Sheets for Educators
- Attend the Google Next 19 conference (give me a shout if you’ll be there!)
- Continue to grow the community on this site and the online school
- Hold more webinars in 2019, on Google Sheets and Apps Script topics
- Personally, I want to deepen my digital analytics and marketing knowledge, particularly GTM, GA and paid Ads, and also continue experimenting with data science and Google Cloud topics. Specifically, I’ll try to find time to work through this book: Data Science on the Google Cloud Platform
Thank you
Of course, none of this would be possible without you readers.
Thank you for giving me this opportunity to share my experiences and knowledge, and carve out this teaching niche. My mission to create a world class resource for learning Data Analysis on the Google platform is just getting started.
Finally, good luck to all of you with your own endeavors and all the best for 2019!
Cheers,
Ben
Previous years
2017 in review and a look forward to 2018