Continuing my recent infatuation with dashboards in Google spreadsheets, I’ve been playing around with the Google Analytics Add-on to build a custom web analytics dashboard in a Google spreadsheet.
The idea originated from discussions with my wife about the tedium of preparing month-end website performance reports for her content management clients. This dashboard was a solution to streamline the monthly web reporting and offer insights that might otherwise be missed. Rather than having to visit Google Analytics for each website in turn and click around gathering the necessary data, this pulls it all together in one place.
The dashboard allows the user to choose which website’s data they wish to look at. The dashboard displays monthly traffic metrics for the past year (and adjusts automatically to always display the most recent year), as well as Social and Referral metrics, all shown in tabular and graphical formats.
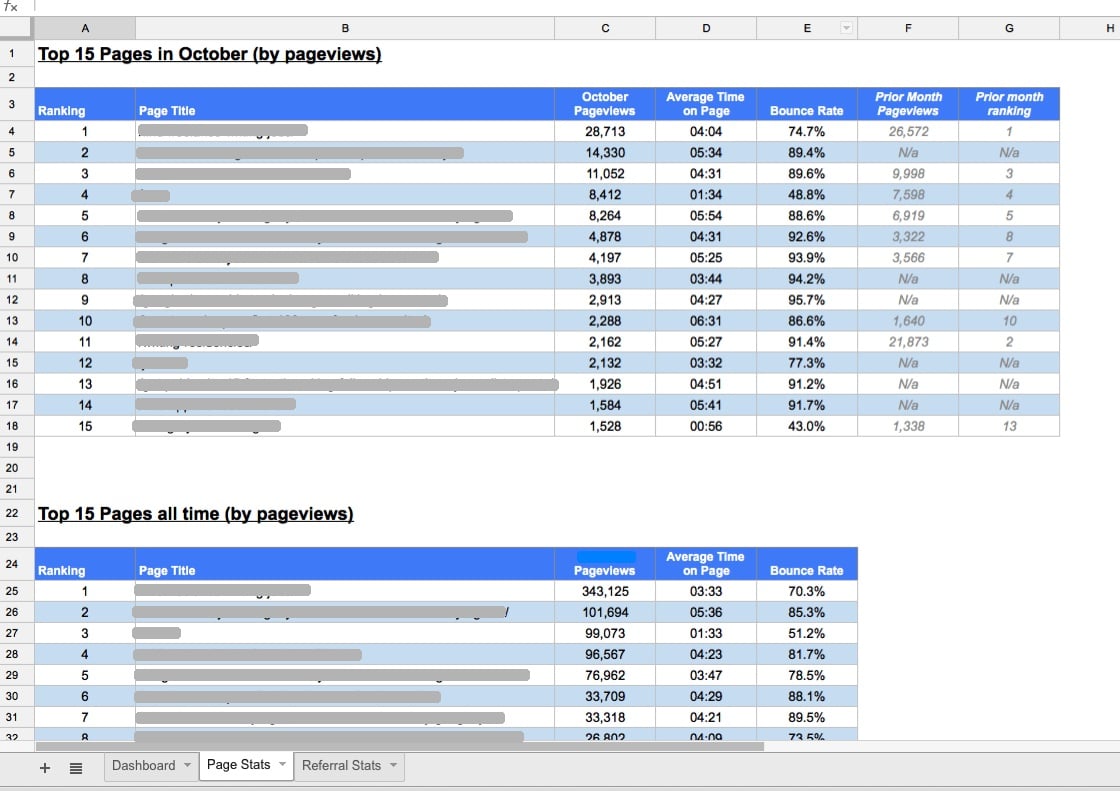
The full dashboard also has tabs for “Top Pages” and “Top Referrals”, which show the results for the last month, and all time. For example, here is the “Page Stats” tab:
This was designed to meet specific needs, but could easily be tailored to show different information. The beauty of pulling Google Analytics data into a Google spreadsheet is the vast level of customisation it gives you.
Editor’s note: this post is intended to give a flavour of how this dashboard was created, rather than a comprehensive step-by-step walk through. If you have any questions leave a comment or shoot me an email.
How to create the dashboard
There are several steps to creating the dashboard:
1. Setting up the Google Analytics Add-On in your Google spreadsheet
2. Setting up the Report Configuration in your Google spreadsheet (the instructions to pull the raw data)
3. Pulling the raw data from Google Analytics into your Google spreadsheet
4. Transferring the raw Google Analytics data into summary tables in the dashboard
5. Finishing the dashboard, e.g. formatting, adding trend lines, charts etc.
Before launching into the mechanics of the report, it’s always a good idea to think through what questions you’re trying to answer as this will determine what data you need. The motivation for this dashboard was to facilitate gathering web traffic data across a number of different websites and then to display the key metrics in one place.
Step 1: Setup the Google Analytics Add-on and find your web property IDs
Google has made it super easy to pull data from Google Analytics into a Google spreadsheet with the Google Analytics Add-on. So first step is to install this – it’s found in the “Extensions” menu –> “Get Add ons” –> search for “Analytics”, then install. No worries, it’s free!
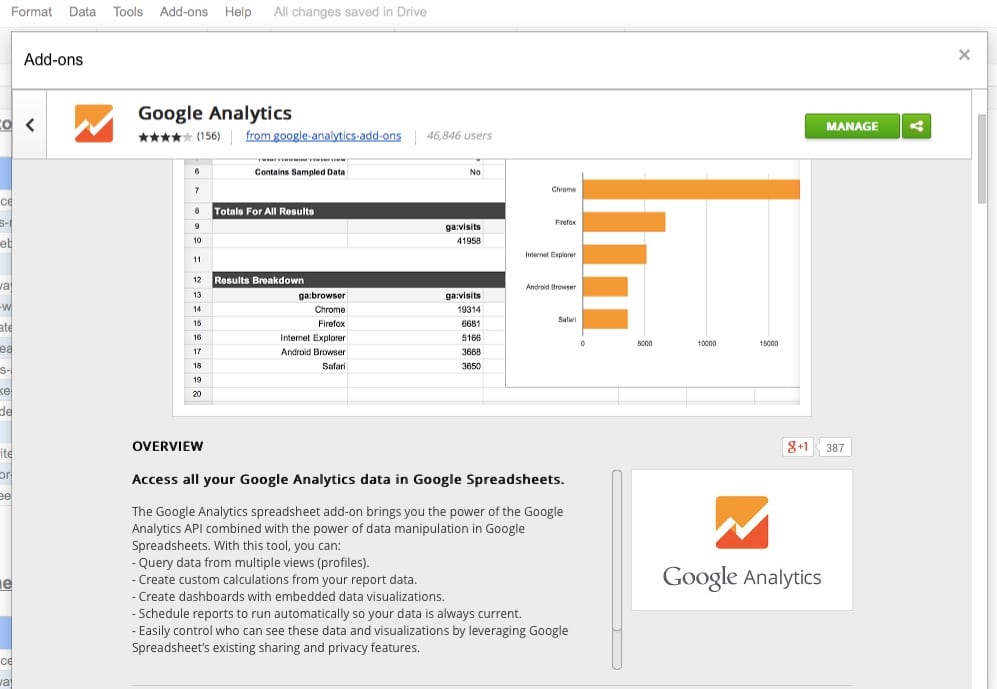
For a great introduction to this add-on tool, check out the official Google docs here.
Once this is installed, return to the “Add-ons” menu and click “Google Analytics > Create a New Report”. A pane slides in on the right side of your browser and prompts you to setup a report. You will see the different websites that you have in your Google Analytics site, so create a report for each one in turn (this allows you to grab the View (Profile) ID / ids for each).
The Report Configuration is the instructions we’re sending to Google Analytics, telling Google what data we want to extract.
This is the key driver of the dashboard, which can be modified to tell Google exactly what we need.
Step 2: Building the Report Configuration tab
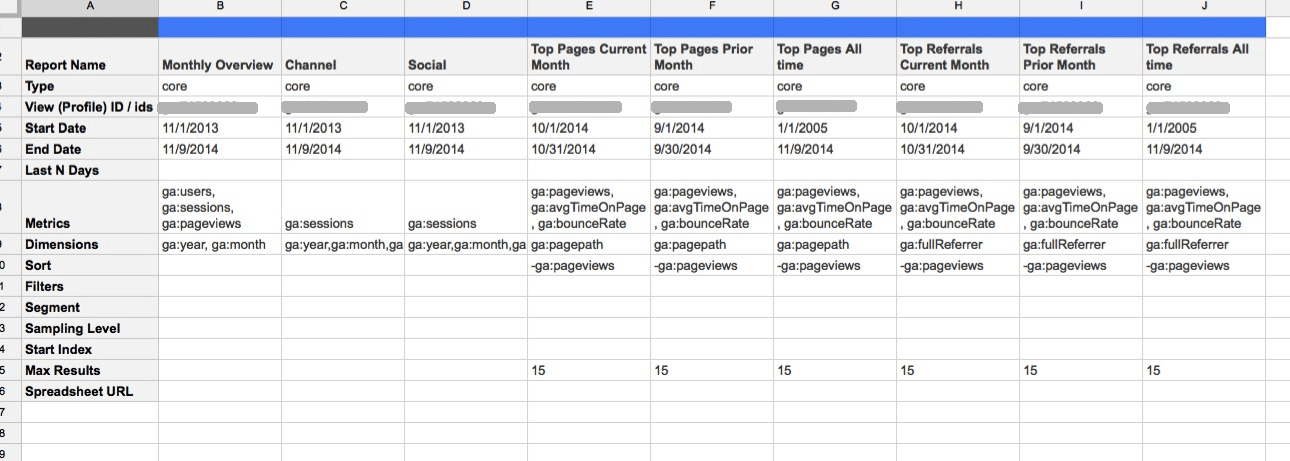
In the Report Configuration, we can specify which website we want to pull data from (by changing the View (Profile) ID / ids field), the start and end date of our request, the dimensions (e.g. pages on website or date ranges), the metrics (e.g. users, sessions, page views, bounce rate), and certain limits on how many records to retrieve. There’s a whole heap more customisation, but that’s a topic for another day.
The trick to making the dashboard interactive and up-to-date is to use formulas to control which website ID and what dates are in the report.
I’m running several reports here to get different datasets for the dashboard. The ones I’ve setup pulled the following datasets:
– Total monthly uniques, sessions, pageviews, going back 1 year
– Monthly uniques, sessions, page views for the different channel groupings (e.g. search, direct, social etc.), going back 1 year
– Monthly uniques, sessions, page views for the different social groupings (e.g. Facebook,twitter etc.), going back 1 year
– Last full month and month prior to that for the Top 15 pages on the website
– Last full month and month prior to that for the Top 15 referrals on the website
To give the user choice over which website they want data for, I use data validation to create a drop-down list. I use the View (Profile) ID / ids information I’ve gathered using the Google Add-on in Step 1. It’s exactly the same set up here as in my previous post, and I put the drop-down menu of websites at the top of the dashboard.
For the start and end dates for each report, I enter formulas into the Reports so they update automatically. Using today’s date as a reference I can then set up other dates based on that, using the following formulas:
1. Current date, using the today formula, which will automatically update:
=today()2. The same month but a year earlier, to give a year timeframe. The following formula achieves this:
=date(year(today())-1,month(today()),1)3. The last day of the most recent full month. This formula includes an “if” condition to determine if today’s date is the end of the month and, if it is, to use that date, otherwise to go back to the previous full month. Take a look:
=if(today()=eomonth(today(),0),today(),eomonth(today(),-1))4. The first day of the most recent full month, using the formula:
=eomonth(E6,-1)+1where “E6” is the cell reference of the formula in point 3.
The dimensions and metrics are the specific pieces of data and numbers that I want to pull out of Google Analytics to analyze.
For this exercise, the dimensions (think row headings on left side of tables) are:
ga:year, ga:month
OR
ga:pagepath
OR
ga:fullReferrer
And for metrics (think numbers in the tables), I’ve used:
ga:users, ga:sessions, ga:pageviews (monthly overview data tables)
OR
ga:pageviews, ga:avgTimeOnPage, ga:bounceRate (specific page/referral tables)
There are a vast number of dimensions and metrics available, which gives a ton of options over what your custom report shows. For a full list of dimensions, and metrics, here’s the Google documentation.
This is what the Report Configuration tab looks like for this dashboard:
Step 3: Creating the dashboard
Run the report as follows, to get back the raw Google Analytics data:
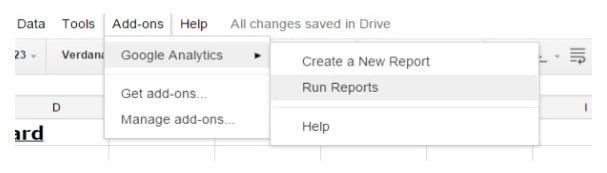
Google will create a series of new tabs in your spreadsheet. Each tab corresponds to one of the reports in your Report Configuration tab, and the tab will have the same name. Next step is to create the “Dashboard” tab which displays summary data from the raw data.
Create empty tables with the current month as a row heading, using the following formula:
=text(today(),"MMMM")Then use the following formula to create the month prior to the current one, as another row heading:
=text(date(year(today()-1),month(today())-1,1),"MMMM")I then keep “rolling” the months back, by changing the “-1” to “-2” for two months prior, then “-3”, “-4” all the way back to “-12”, to give the current month plus 12 preceding months in an empty table.
(The yearly column in the table is created with the same formulas but replacing “MMMM” with “YYYY”.)
Use formulas to pull across the data from the raw Google Analytics tab tables. In most cases, it’s enough to use a simple link to the cell that has the data.
However, for the Channel and Social overview tables, where I want to show each channel or social channel month-by-month, I had to use a multi-condition lookup formula, since I needed to specify three criteria (year & month & channel). Take a look:
=ArrayFormula( index( Channel!$D$15:$D$100, match( $A47&$U47&W$46,Channel!$A$15:$A$100& Channel!$B$15:$B$100& Channel!$C$15:$C$100,0)))Crazy huh! This formula uses the powerful index/match formula on steroids, in an array formula to lookup multiple values across multiple columns in the Google Analytics raw data table. It concatenates the year, month and channel, that I want to use as my lookup value, then looks for this concatenated value in the Google Analytics raw data across the year, month and channel columns. When it finds the right match it returns the corresponding result. It’s truly awesome, a vicious left, right, left knockout combo.
The following formula is used for the monthly % growth column:
=iferror((C6-C5)/C5,"No data")where an IFERROR function is used for cases when there is not enough data for the calculation.
At this stage, the dashboard is a series of plain tables, populated with data that changes based on the user’s choice of website and automatically adjusted for the current time period. The next step is to add some visual components and format the dashboard into something more user-friendly.
Step 4: Adding flourishes to the dashboard
Sparklines are miniature charts that exist in a single cell of your Google Sheets:
=sparkline()Sparklines were first created by data viz legend Edward Tufte. The trend line looks like this:
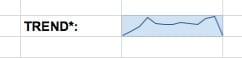
I added one of these sparklines for each dataset that was based on a timescale.
The last component of the dashboard was to add some simple charts, giving a graphical depiction of data in the tables. In this case, I added a bar chart for the monthly uniques table and some pie charts to show the most recent month’s channel and social metrics, but of course, there is a multitude of options using Google’s built-in charting capabilities.
As a final touch, I hid all of the Google report tabs (don’t worry, they still function in the background!), removed the gridlines, and then gave all the tables a consistent format, with light grey borders and light blue shading on alternate lines.
Have you been successful with this if you want data that is segmented in GA? Or in a shortcut (segmented and filtered)?
Hey Julie, you can definitely have segmented data in these sorts of reports. In the “Report Configuration” tab you’ll see there’s a line for “Segments” where you can specify e.g. “ga:deviceCategory==mobile” for a mobile segment.
More information can be found here: https://developers.google.com/analytics/devguides/reporting/core/v3/segments-feature-reference
and here: https://developers.google.com/analytics/devguides/reporting/core/v3/segments
Hope that helps!
Is it possible to look into the sheet? I do not know why, but the month formulas you’ve given simply don’t work in my sheet. Maybe it’s because I work in a version with a different language? Some formulas take, others simply give an error – and I’m a little lost. A sheet like yours is my goal, maybe looking into it can help.
Hi Wanda! Not sure why this is a happening. I created this sheet which shows the first page of the dashboard with all of the date formulas in, so hopefully this will help you: https://docs.google.com/spreadsheets/d/1Uv3d66AOs55z8O1yyvuXWYmm8nxtcZxBccuWh6UpTRE/edit?usp=sharing
Let me know if you still have questions and I’ll try to help.
Ben, thank you! This helped a lot. I saw where I made the mistake – I missed a part of the formula.
For “previous” month, I started using another formula, where I used start date and end date, but this formula seems much cleaner.
Thanks again!
Great!
Great post with lots of imtoprant stuff.
I love love love this – and hope I can replicate it – I don’t have the luxury of time to replicate custom reports – so just downloading a custom dashboards from Google Analytics monthly now – but I do want to do something that’s nice and easy to follow. Louise
Thanks Louise! Feel free to ask any questions here and good luck building!
Hi!
Nice article, I just have a question though, What if I have 2 different dates (last week vs this week; last month vs this month)in the report configuration, is it possible that when I schedule it to run weekly/monthly, the start and end dates will be automatically changed? Or do I have to change it?
Thanks!
Hi Ailyn,
Sure you can set your Google Analytics Report Configuration to have dynamic dates that change automatically, so your scheduled reports will pull the latest data. Use the formula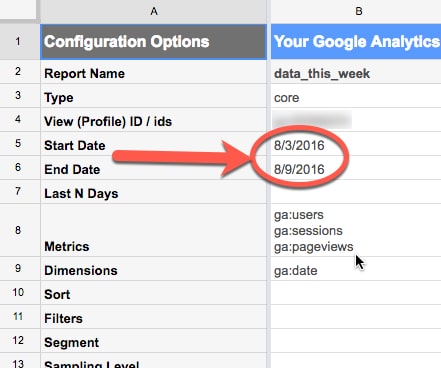
=TODAY()and then base your formulas off that to get weeks or months. The start/end dates can be changed in your reports here:There are some date formula examples in the above article – see here.
Hope that helps!
Ben
Hi,
I don’t get how you were able to populate a table with data for each month. Afaik GA only exports the TOTAL users/sessions/conversions etc, not day-by-day/week-by-week data… For example if I query user/session and set the start/end date to be a period of 1 year, and I run the report, it’ll just literally give me 1 number, the total users and total sessions…
Can you show how you’re able to create that table where you have data for each month? I’m trying to do a similar table with weekly data.
Thanks.
Hi,
If you add “ga:date” (for daily) or “ga:month” (for monthly) to the dimension field in your GA Report Configuration tab, this should give you the daily or monthly breakdown you’re after.
Hope that helps!
Cheers,
Ben
Hi, probably something I’m missing as I’m new to all this, but these formulas to create the dates on the dashboard just give up a error whatever I do, can you think of any thing I may be doing wrong? Thanks
=text(today(),”MMMM”)
=text(date(year(today()-1),month(today())-1,1),”MMMM”)
Hey Danny,
It looks like the problem is with your quotation marks around the MMMM. If you’ve copied the formula direct from the blog post (or other site), then the quotes will often turn into the curly type quotes (”) whereas the formula requires straight quotes (“). Subtle I know, but hopefully this fixes it for you.
Top one has curly quotes and gives an error message:
Hope that helps.
Cheers,
Ben
Hi Ben,
This is really helpful. Do you know how can we create the Google Analytics dashboard in powerpoint?
I can think of only one solution
Pull the Data in Google spreadsheet >>>Create slides in Google Slides >>>Save the Google Slides as Microsoft Powerpoint
I am not so sure if 2nd part of this process will work. Will Google slides be updated automatically as soon as spreadsheet is populated?
Thanks in advance for your help
Regards,
Amit
Is there a link to this spreadsheet?
Hey Dee,
No, no link to this one at the moment. If I find time to create a shareable version I’ll post here and let you know.
Cheers,
Ben
Thanks Ben
Hi Ben,
The relative date formulas in the Year column on the dashboard seems to be off and is showing 2015, 2016 an 2017 instead of just 2016 and 2017. Do you have any suggestions on how to fix this? It seems to be a recent issue.
On report configuration, under the channel and social columns what is the third dimension. It is cut off in the example and for some reason, I can’t seem to figure out what it is. Thank You!
Hey Justin,
The third dimension is
ga:channelGroupingSo it reads:
ga:year,ga:month,ga:channelGroupingGood spot!
Cheers,
Ben
Hello Ben,
Thank you for your quick response. I am having one more issue when using the =ArrayFormula(index(Channel!$D$15:$D$100,match($A47&$U47&W$46,Channel!$A$15:$A$100&Channel!$B$15:$B$100&Channel!$C$15:$C$100,0)))
It continuously tells me that it “Did not find value ‘Year ‘ in MATCH evaluation.”
I have tried to adjust the formula with no luck. Any ideas on what I can do to fix this?
Thank you
Hey Justin,
On your Channel sheet, does your table look like this:
It should have a year column (which will now show 2017, not 2014) in column A. Then in your final table on the dashboard, you should have years (2016/17) in that table too.
Let me know if that helps…
Cheers,
Ben
Hi Ben,
Big fan of the post, thanks for sharing.
I have a question about pulling metric data into the dashboard. In the raw data I am using ga:month, which is a number between 1-12, but in the dashboard the months are by name (January, and so on).
How do you connect the two? Didn’t see a GA dimension that accommodates this, unless I missed it.
Thanks again
I guess I could create a hidden column that converts month name to number =MONTH(DATEVALUE(B6&”1″)), but if there’s a better way I would definitely use it.
Hey Jeff, you’re correct that the months come through as numbers 1 – 12, which you can’t change directly into their word counterparts. So in the tables generated automatically when I run the GA reports, I have numeric months.
The dashboard is a new table with formulas to generate months on a rolling basis, working back from
=text(today(),"MMMM")(see section 3 of the above post), so that they line up with the numeric months. Then I just bring the data across for the right month.Hope that helps!
Ben
Hi Ben, awesome post and very informative! I came across it while searching for a solution to whether you can use CUSTOM channel groupings as a dimension. It seems not possible after many google searches and much forum browsing!
Thought I’d ask – do you know if it is possible to pull data from a custom channel grouping (not the default) I created in the GA UI, into the ga:channelGrouping dimension in my google sheets report? Is there a regex or other callout I can add? Thank you!
Thanks for I have heard about Google custom report which is really a cool feature of Google Analytics. With the help of this feature we can also create our report in Google analytics. Now i came to know about creating google custom report in google spreadsheet which also looks like a helpful feature.
Hi Ben, thank you for this post. I am however looking for ga:pageviews but for a specific page. May I know how to go about this?
Hi Ben, I was wondering if you could explain how you were able to configure that dropdown on the dashboard which “allows the user to choose which website’s data they wish to look at”? Please let me know. Thank you.