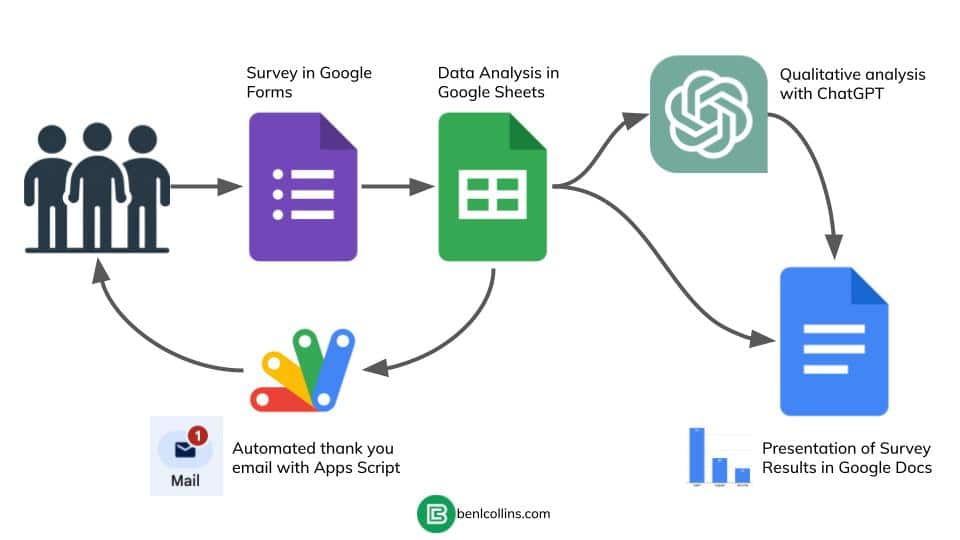
This post describes how I designed and ran an audience survey with over 1,700 responses, using Google Forms, Sheets, Apps Script, and ChatGPT. I’ll show you the entire process from end-to-end, including how I:
- Created a survey with Google Forms
- Used Apps Script to automatically say thank you to 1,700 respondents
- Analyzed the response data in Google Sheets
- Used AI to help me understand the qualitative data
- Presented the results in Google Docs
This flowchart shows how the system is set up:
1. Creating a Survey with Google Forms
Before you dive into Google Forms, it’s important to understand the goals of your survey. You’re asking your audience to give you their time, so you don’t want to waste it. You can run an annual survey, but more frequently than that will annoy your audience. So you want to ask the right questions, since it’s your once-a-year chance.
Survey Goals
My goals were to understand:
- My audience demographics
- How they use Google Sheets
- What other tools they use
- Whether they use AI (or not)
- What their learning goals are for 2024
The answers to the questions in these categories will directly help me plan out my content and courses for 2024.
I can’t stress enough that it’s worth spending time thinking about your goals and what you’ll do with the answers.
Survey Design
Once you have clarity on your goals, you can jump into Google Forms and craft your survey. I ask mostly quantitative questions because they’re easier for users to answer and for me to analyze. But the best, most specific information is buried in open-ended questions (qualitative data). I make the quantitative questions required and the qualitative questions optional.
Make your survey look professional with a header image and an introductory paragraph.
I collected email addresses from each respondent, so I could say thank you and follow up if necessary.
I also split my questions across several pages. This gives users a sense of completion as they work through the survey. Seeing all the questions in one super long page might put some people off.
Here’s the first page of my survey:
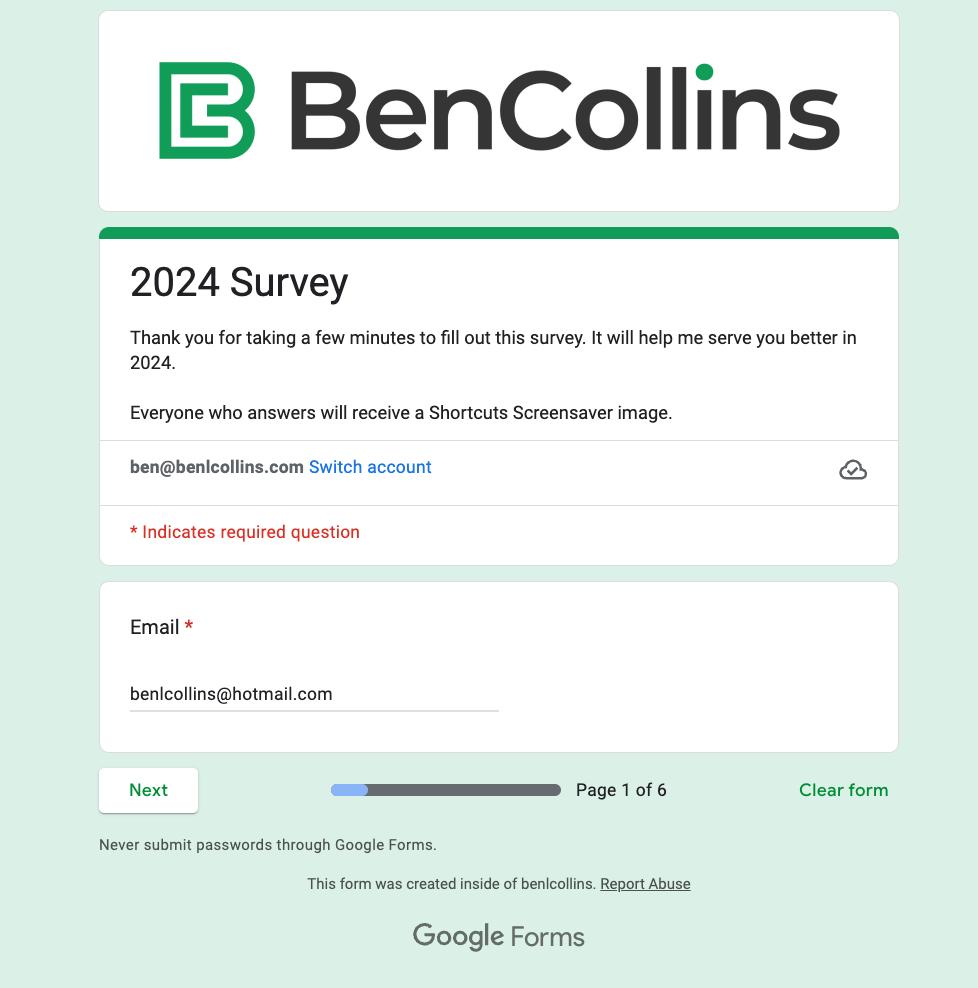
You can see the full survey here.
Google Forms Survey Results
The Google Forms survey was sent to 64,323 people. 1,706 responded, which is a 2.7% conversion rate.
The margin of error for my survey, with a 95% confidence level, is approximately 2.34%. This means that the results are estimated to reflect the views of the entire population within a 2.34% range above or below the survey’s findings (calculator).
Although you can review the results directly in the “Responses” section in Google Forms, it’s much more effective to review the data in Google Sheets.
Google Forms Response Data in Google Sheets
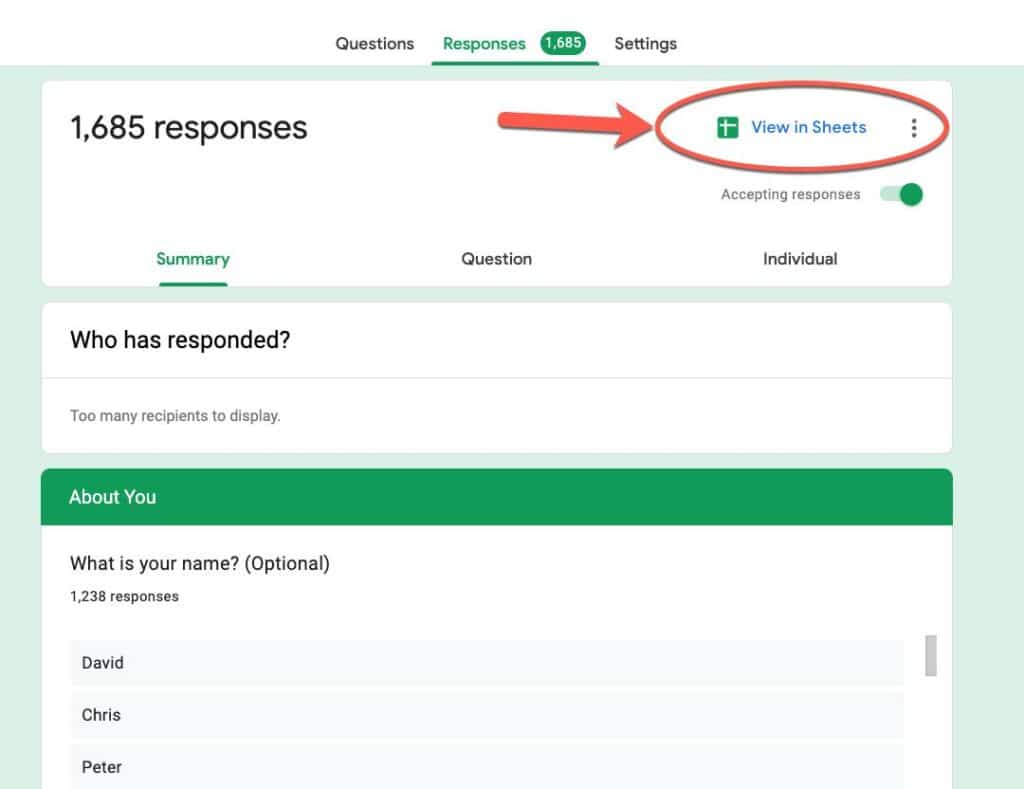
From Google Forms, click on “View in Sheets” to open the responses in a new Google Sheet, located in the same Drive folder as the Google Form:
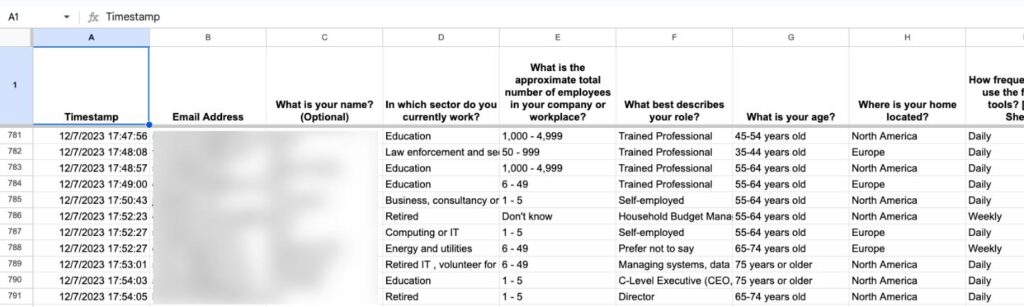
In Sheets, you can do much more with the survey data.
But first, I’d better thank the respondents. All 1,700+ of them!
2. Sending Automated Thank You Emails with Apps Script
I created an exclusive Google Sheets Shortcut screensaver as a thank-you-for-responding gift.
Here’s a low resolution version of the image:

But, even with canned responses, it would take too long to manually email 1,700+ people. So I knew I had to automate this step.
I used Apps Script to automatically send a thank you email to everyone. The email contained a link to download the screensaver. (If you’re not familiar with Apps Script then you could do something similar with a service like Zapier.)
This is the email I sent to folks using Apps Script:
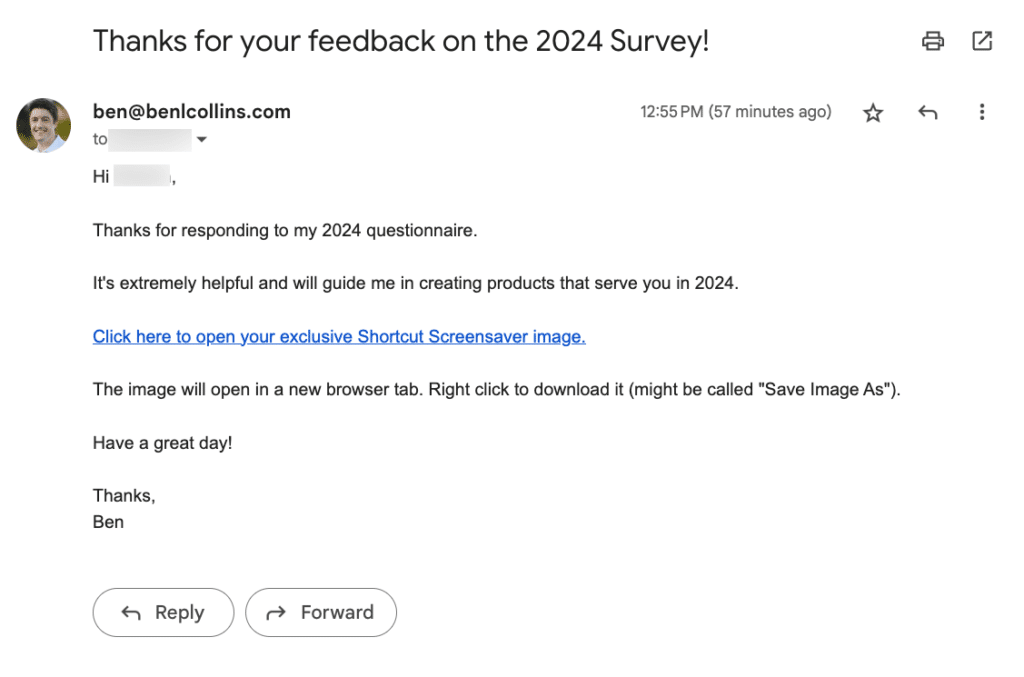
When they clicked on the link, it opened the full resolution screensaver image in a new browser tab for them to download.
Automation Plan
The steps to send these automatic emails:
- In the Google Sheet with the response data, go to Extensions > Apps Script
- Remove the boilerplate code in the file so that is completely blank
- Add the code shown below
- Name and save your Apps Script file
- Click run and grant Permissions to the script
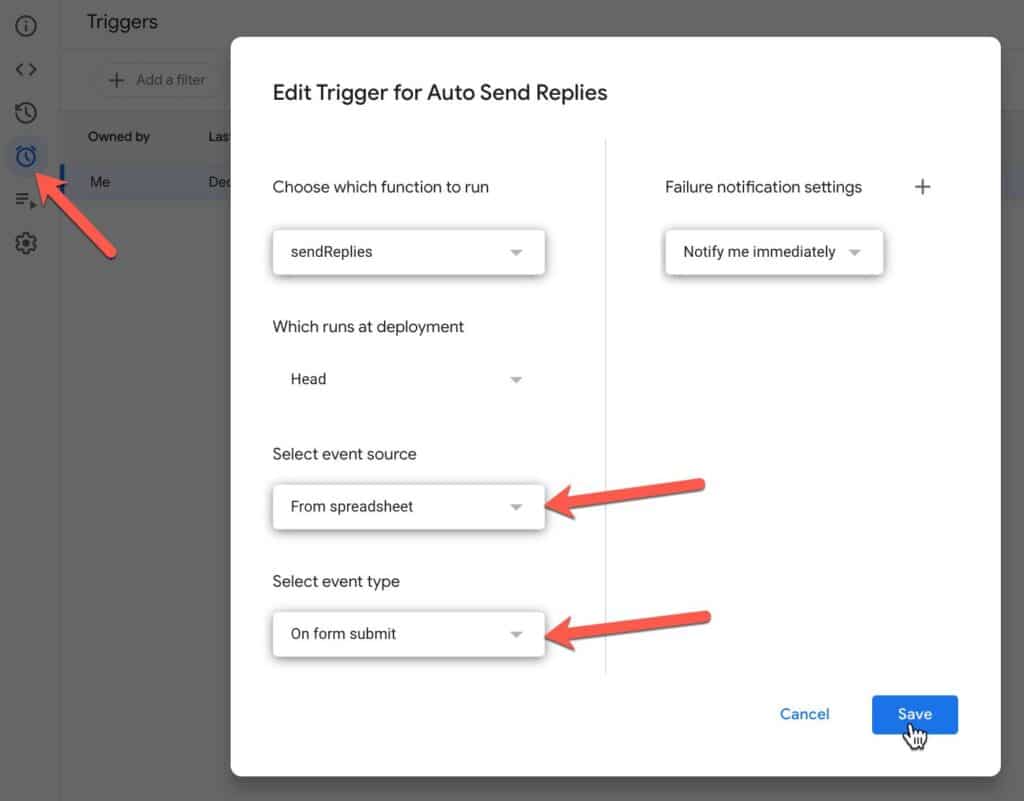
- Go to the Triggers menu in the sidebar of your Apps Script file
- Add a new trigger
- Select “From spreadsheet” for the event source
- Select “On form submit” for the event type
- Test it works by submitting a form with your own email. You should receive a reply and the row of data in your Sheet should be time-stamped.
Apps Script Code
Here is the code to send the automatic replies and deliver the digital download:
/**
 * sending replies automatically
 */
function sendReplies() {

  // get data from sheet
  const ss = SpreadsheetApp.getActiveSpreadsheet();
  const sheet = ss.getSheetByName('Form Responses 1');
  const allRange = sheet.getDataRange();
  const allData = allRange.getValues();
  const lastCol = sheet.getLastColumn();

  // remove the header row
  allData.shift();

  // loop over all the rows
  allData.forEach((row,i) => {

    console.log(row[42]);
    if (!row[42]) {

      // get data
      const email = row[1];
      const name = row[2];

      // send an email for each row
      console.log("Send the email");
      sendEmail(email, name);

      // mark row as complete
      const emailSentTimestamp = new Date();
      sheet.getRange(i+2,lastCol).setValue(emailSentTimestamp);

    }
  });
}


/**
 *  send an email with the feedback
 */
function sendEmail(email, name) {

  // create subject line
  const subjectLine = 'Thanks for your feedback on the 2024 Survey!';

  // create email body
  const htmlBody = `Hi ${name} + ,<br><br>
    Thanks for responding to my 2024 questionnaire.<br><br>
      It's extremely helpful and will guide me in creating products that serve you in 2024.<br><br>
        <a href="https://www.example.com/Example-Cheat-Sheet-ShortCuts.jpg" target="_blank">Click here to open your exclusive Shortcut Screensaver image.</a><br><br>
        The image will open in a new browser tab. Right click to download it.<br><br>
        Have a great day!<br><br>
          Thanks,<br>
            Ben`;

  // send email
  GmailApp.sendEmail(email,subjectLine,'',{htmlBody: htmlBody});
}
The script adds a timestamp to each row after sending the email. Then, when the script runs again, it won’t send emails to any rows that have a timestamp.
I created an “On Form submit” trigger to run this script every time a new response was received:
3. Analysing Survey Data in Google Sheets
Pivot Tables to Analyze Data
Pivot Tables are arguably the most useful feature of spreadsheets when you’re working with data.
They let you slice-and-dice your data quickly and easily.
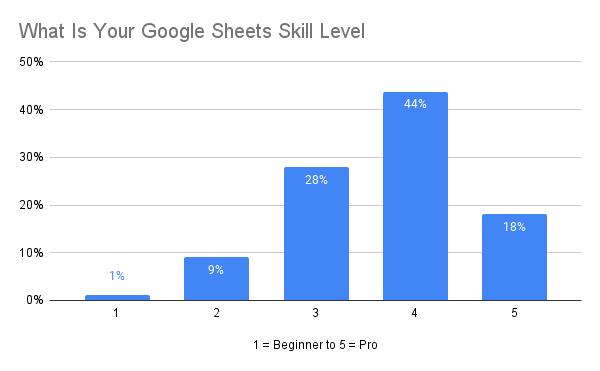
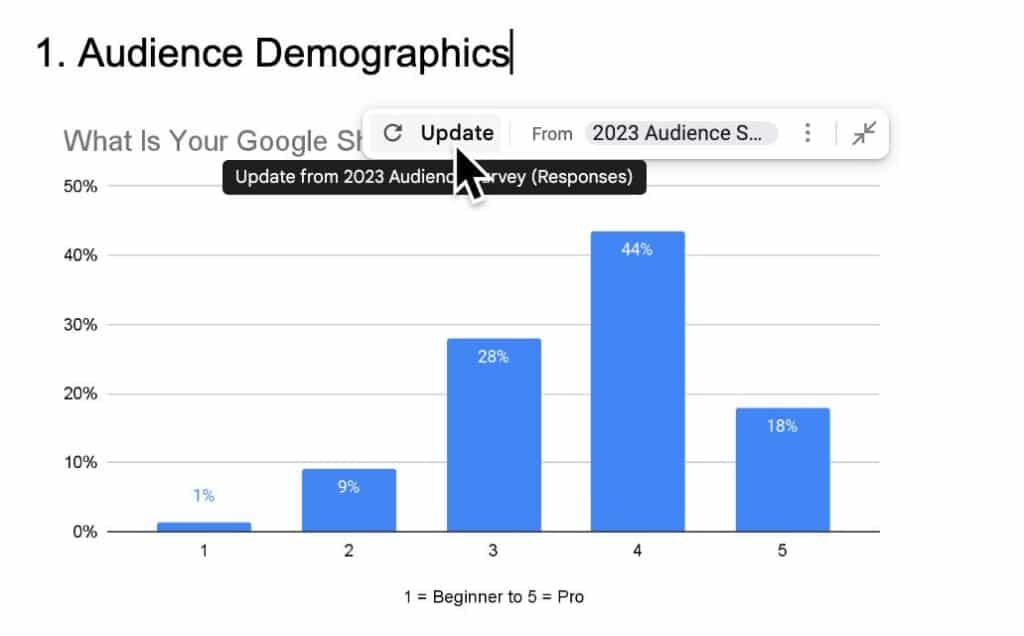
In this case, most of the pivot tables were simple counts of items in a category. For example, this pivot table counted how many people were in each bucket of Google Sheets skill levels:
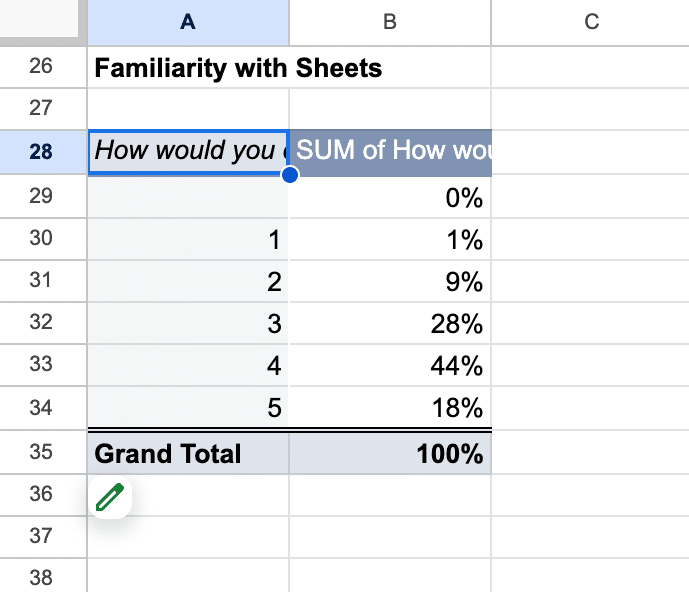
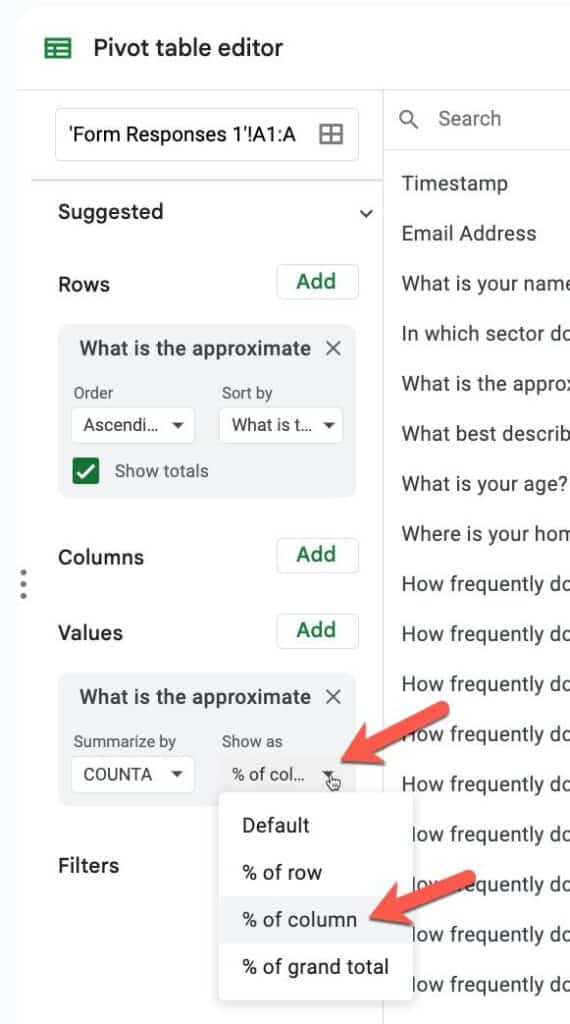
Since I was interested in relative results, not absolute numbers, I converted the counts to percentage figures, by setting the metric to “% of column”:
Since the results were a proxy for my entire audience, it’s more helpful to think that 44% of people have skill level 4 (experienced) than to say “633 people have skill level 4”.
I visualized these results with a simple column chart (go to Insert > Chart):
Analyzing Qualitative Response Data with Formulas
In one of the questions, I asked readers what other data tools they used at work. I left it as an open question where folks could type in whatever they wanted. So of course, I got answers like “Excel”, “MS Excel”, “Microsoft Excel”, etc.
In fact, I ended up with 571 unique entries. I dropped them into a pivot table with a count of how many times they appeared. Then I used formulas to combine tool counts.
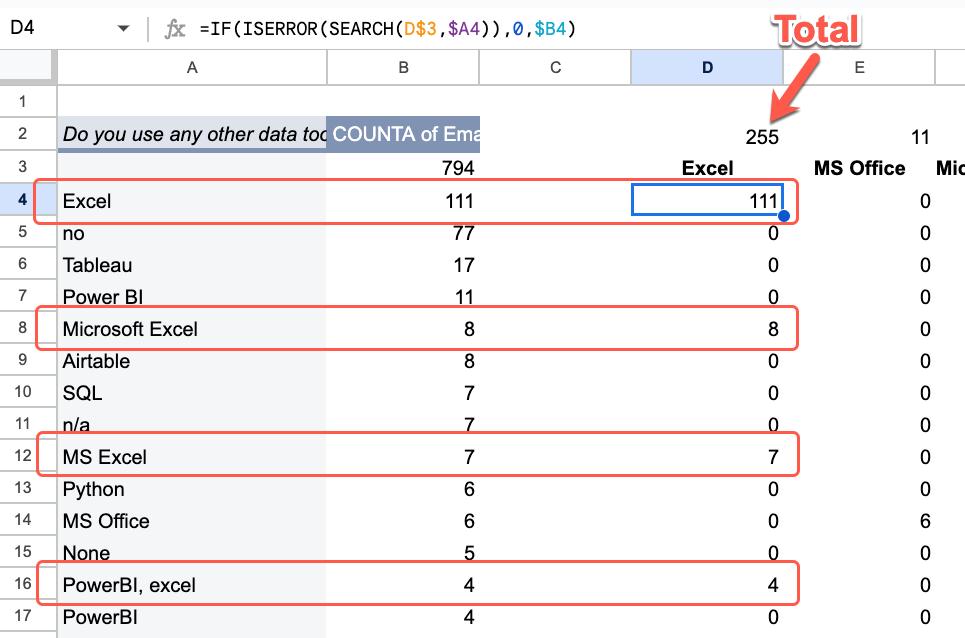
=IF(ISERROR(SEARCH(D$3,$A4)),0,$B4)This formula searches for the term “Excel” in each row of the pivot table. It’s case insensitive so finds “Excel”, “excel”, “MS Excel”, “Microsoft Excel”, etc. For rows that do not contain the search term (e.g. the row with “Tableau”), the SEARCH function returns an error. I used ISERROR to check for errors and an IF function to return 0 if there is an error or the row total if there is no error (i.e. the search term was found).
Then I added a simple SUM formula above each column to add all the row totals and get a grand total for each tool:
=SUM(D4:D)Now I had a list of tool names with approximate counts, I transposed the data into a small table and created a simple column chart:
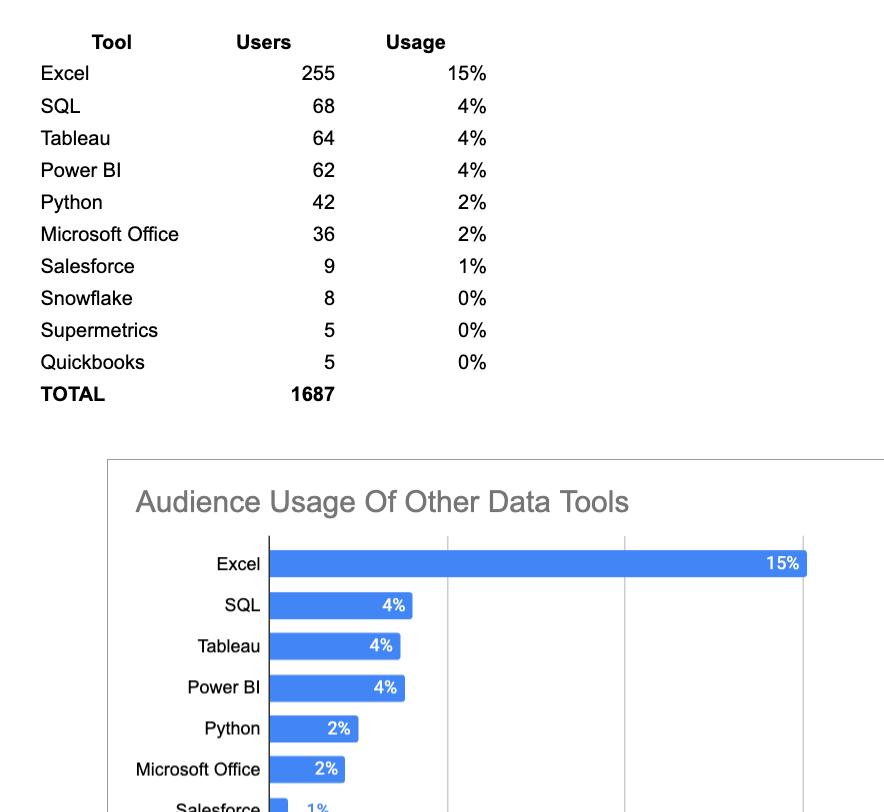
This technique worked well for this specific example because the question was still narrow. The answers were mostly the names of other tools or short sentences containing the names of other tools.
What about the broader questions though? E.g. “If you use AI, can you describe how you use it at work”?
Because the answers are so varied, there’s no easy or time-efficient way to summarize the data using traditional methods like formulas or pivot tables.
Instead, it’s a great problem to solve with modern AI tools. They’re great at digesting and summarizing large amounts of text data. Let’s see how.
4. Using AI to Understand Qualitative Data
Qualitative data refers to non-numerical information that is typically descriptive in nature. In this case, I asked some open-ended questions (e.g. “What skill(s) would you most like to learn in 2024?”).
1,700+ records, where each record is a sentence or paragraph, is a lot of data.
I read each response and made careful notes of specific issues and questions. This would let me reply individually when I had time. But it’s hard to get an overall sense of the corpus of data — a 40,000 ft view.
Enter ChatGPT.
Analyzing Qualitative Google Forms Data with ChatGPT
I opened a new ChatGPT window and entered the following prompt:
Prompt 1
I sent a survey to my newsletter audience and received 1600 responses. The open-ended questions are taking a long time to review. If I copy the answers here, can you summarize the main takeaways in 5 – 10 bullets?
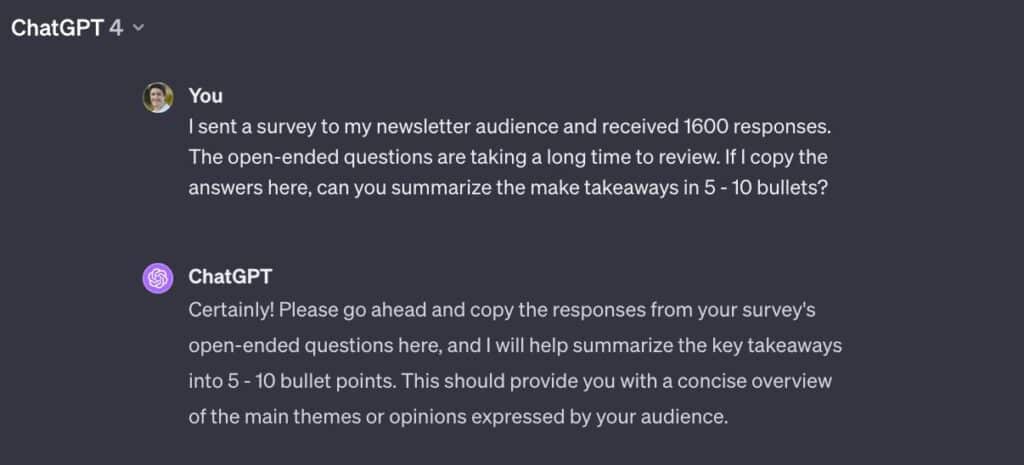
Prompt 2
Next, I copied and pasted the 1,700 rows of response data (from that single column only) into ChatGPT. Here are the first 10 or so rows:

ChatGPT did its thing and within a couple of minutes had 10 takeaways for me:
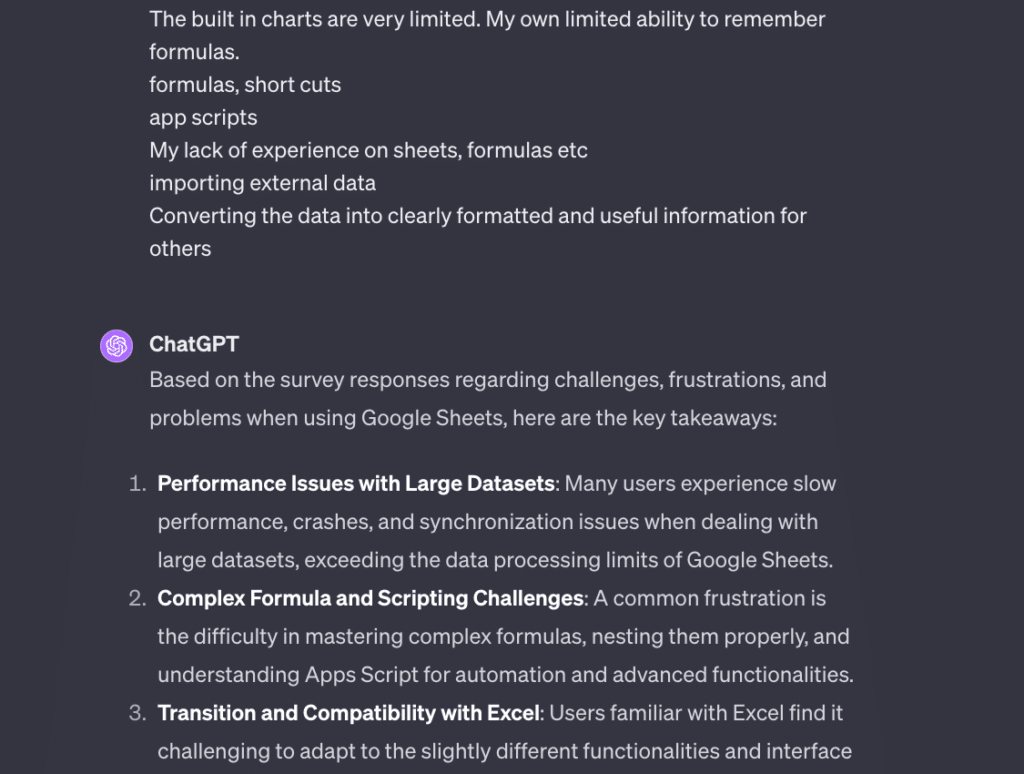
This is hugely useful and something that is hard to do manually with this much data.
Prompt 3
I continued by asking ChatGPT to summarize other question responses from the Google Forms data.
thanks, i have another question that I’d like you to summarize the responses. The question is “If you use AI, can you describe how you use it at work?”
Followed by the response data.
Prompt 4
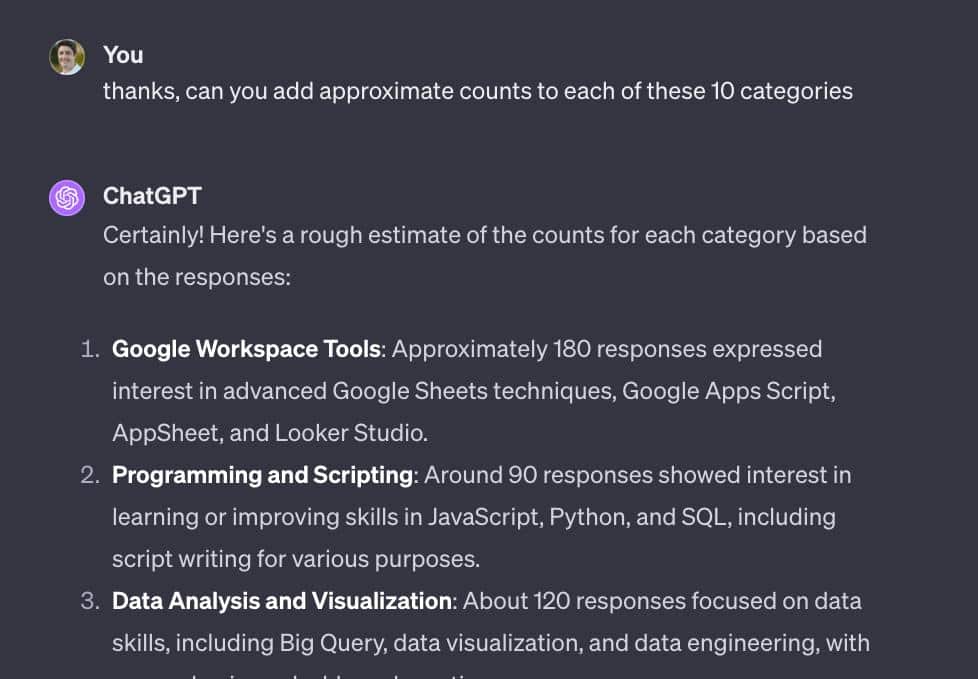
I also asked it to add counts to each category to give me a sense of how many people expressed this sentiment:
thanks, can you add approximate counts to each of these 10 categories
5. Presenting Survey Results in Google Docs
Since this project is not for external consumption, I used Google Docs to compile the results. Google Slides would have been a more natural choice for presentations.
I opened a blank Google Doc (pro tip: type docs.new into your browser!) and pasted in the charts from my Google Sheets and the takeaways from ChatGPT.
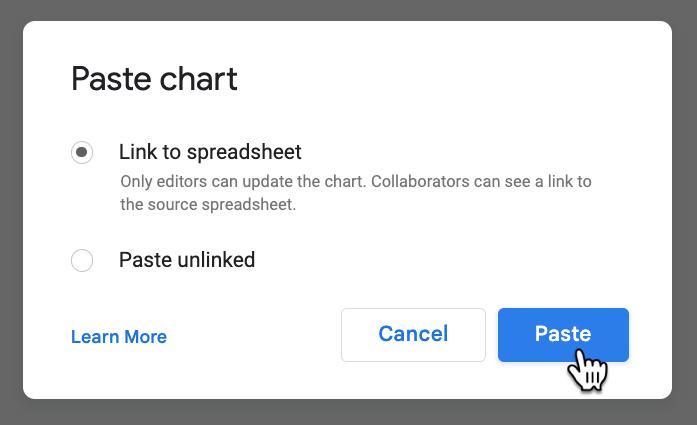
If you select a chart in Sheets and copy it (either Ctrl + C or right click and select “Copy”), you can then paste it into Docs or Slides as a linked object.
This connects the chart displayed in your Docs or Slides back to the original data. Then, if your data changes in Google Sheets — e.g. when more people respond to your survey — your “external” charts update.
Select “Link to spreadsheet” when you copy your chart into Google Docs (or Slides):
Then, you can easily update the chart from Google Docs whenever the underlying data changes:
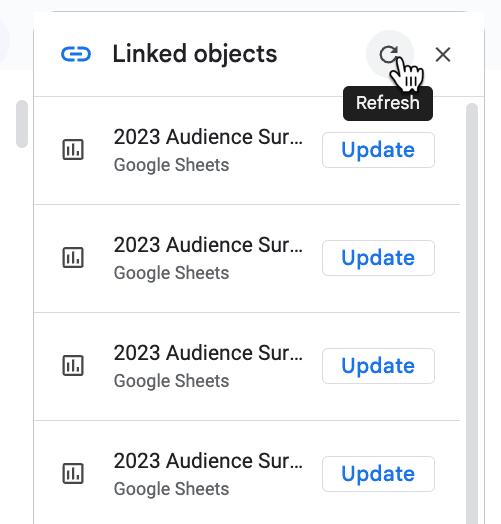
Best of all, if you have a lot of linked objects, you can refresh them all in one go. In Google Docs (or Slides) go to “Tools > Linked objects” to open a sidebar showing all the linked objects in your Doc.
Click the refresh icon at the top of the sidebar to update them all in one fell swoop.
Ensuring Data Flows To Linked Objects
To ensure any changes flow through to your linked objects, you need to set up your pivot tables and/or formulas in the analysis step to accommodate the extra rows of data. Use open ended range references (e.g. A1:H instead of A1:H700) or add plenty of additional rows in excess of how many responses you anticipate.
Interesting Findings
Before I leave, I want to share a couple of interesting findings from the survey.
I asked “How often do you use AI at work?” and the results showed about a half-half split between folks who use AI and those who don’t.
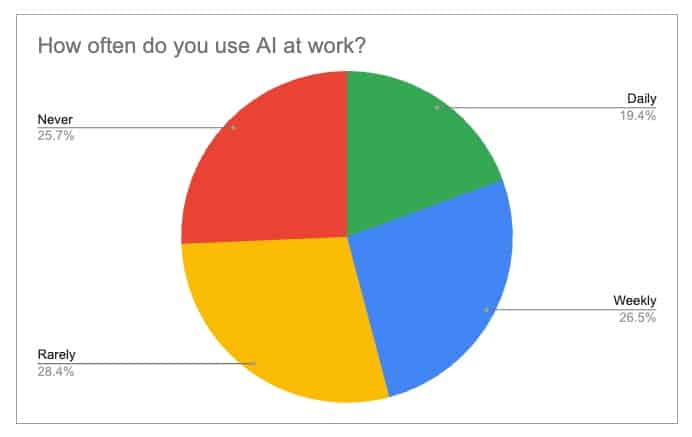
This was surprising to me. More people are using AI than I expected, which is great to see.
I suspect there is a built-in bias at work here though. People filling in my survey are likely to be more motivated than average and probably ahead of the curve with technology adoption. And therefore perhaps don’t fully resemble the trends within the wider population. But, just a hunch.
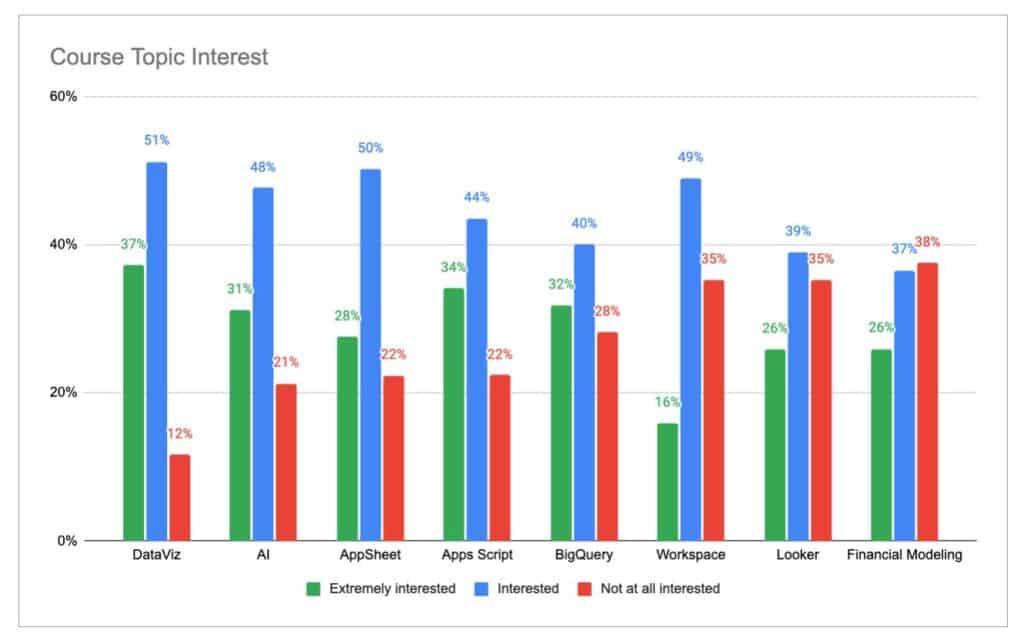
Another key question for me was around course topic interest. I asked people whether they were “Extremely Interested”, “Interested”, or “Not at all interested” in various course ideas on my shortlist. The results are extremely helpful for me to the most impactful courses for my audience.
Any comments or questions, feel free to leave them in the comments below!
Wow! The result of the survey are extremely interesting. This kind of work is inspiring and the way you linked different Google’s app is amazing. Well done Ben and thank you for sharing this workflow.
Thanks, Giuseppe!
Thanks a lot dude. I was in trouble How to present my primary data in research report. Through your analysis I got a detailed idea about that. Thanks a lot …
Thanks a lot Ben, I found the using ISERROR to do the search within text really useful!
Also the auto-reply email script!
Hi Ben, this is very helpful. We are implementing a Feedback button linked to a Google Form on our knowledge base to better understand user behaviour and improve our information based on user feedback. Can you suggest an AI tool that can help automatically summarize responses from google form and share them as useful insight to our stakeholders for potential actioning?