What AI Can Do For You As A Google Sheets User. Is The Hype Justified?

In this post, we’re going to take a 40,000 ft view of the Artificial Intelligence (AI) landscape and see how you can use it alongside Google Sheets to boost your productivity.

And, at the end of the post, I’ll answer the question about whether I think the AI hype is justified.

Before looking at what AI can do with Google Sheets though, let’s start with a quick AI 101 to ensure we’re up to speed with the lingo.

Green Tea Image generated by Dall-E
Image generated by Dall-E, a deep learning model, using the prompt “a cup of tea with a green potion inside with thin swirling vapors rising out of it”

Continue reading What AI Can Do For You As A Google Sheets User. Is The Hype Justified?

Bullet Chart in Google Sheets with Sparklines and Named Functions

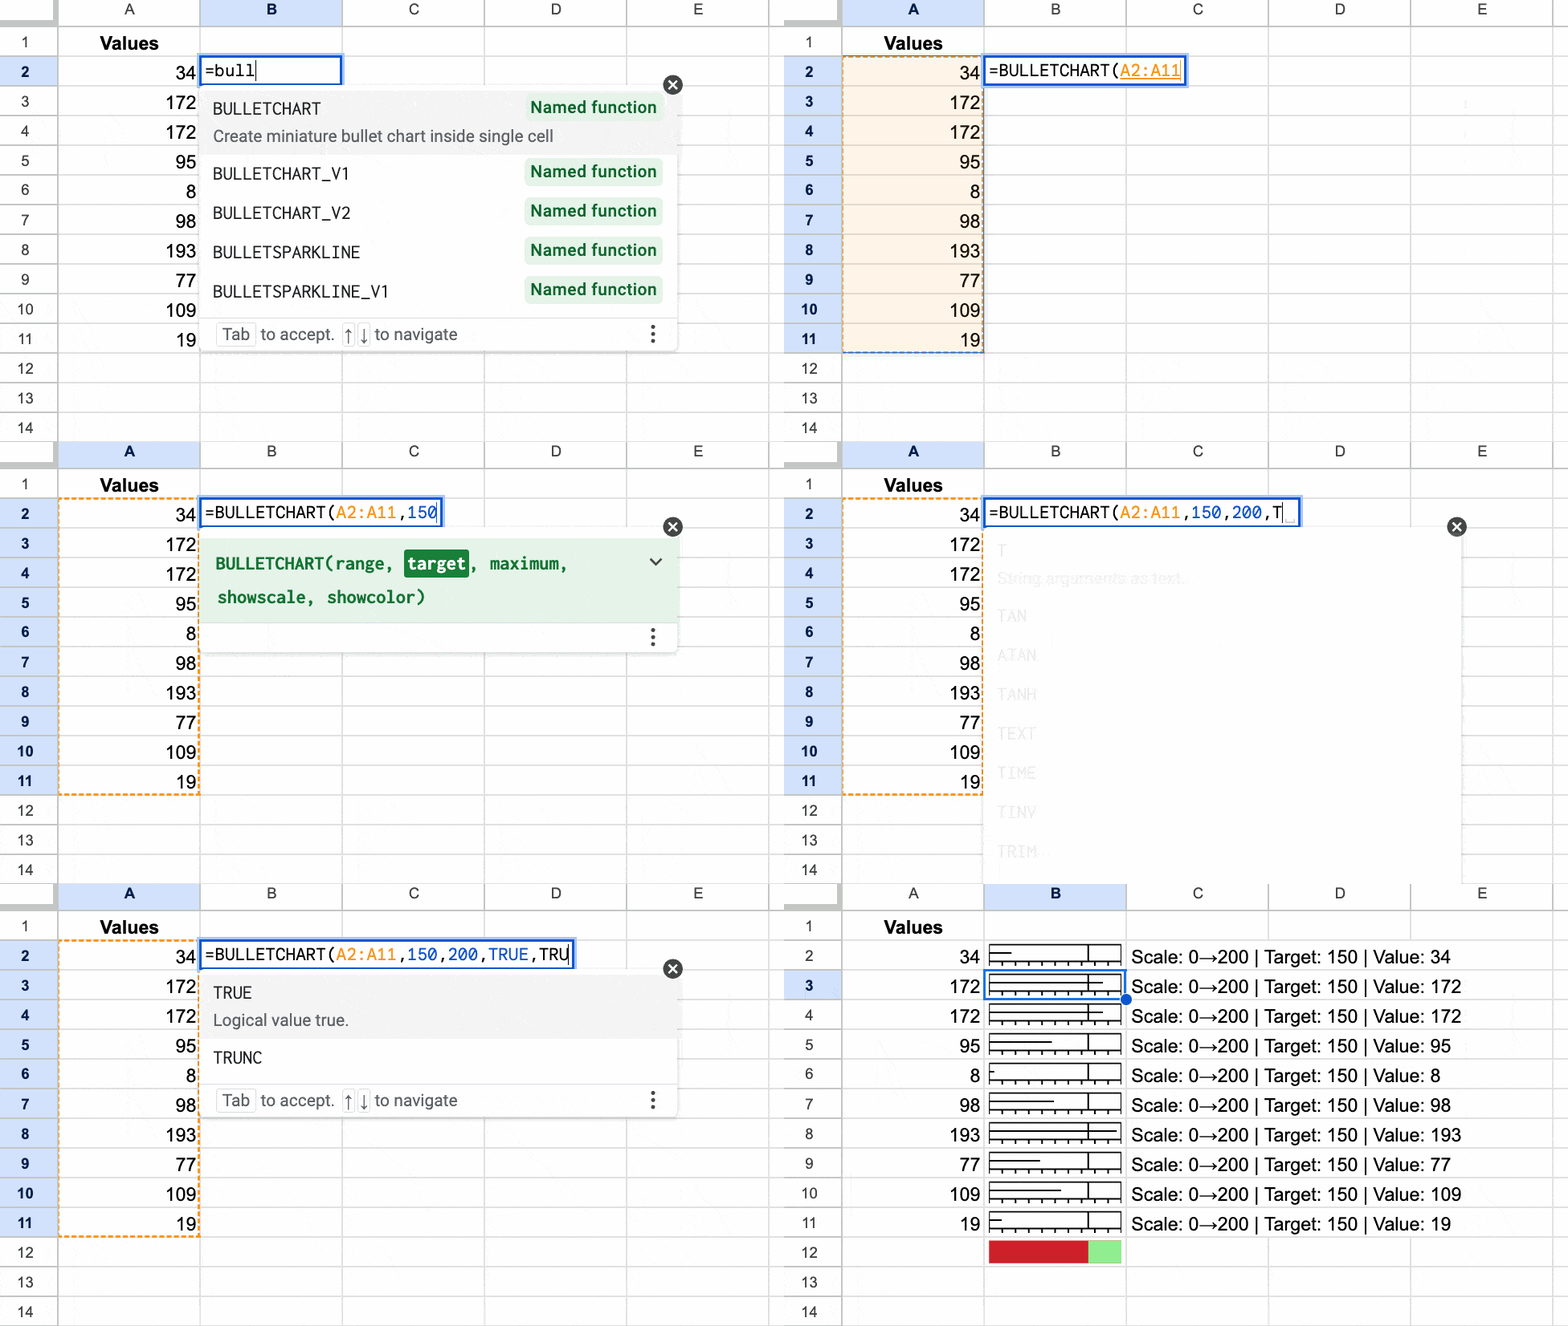
In this post, we’ll build a named function that creates a miniature bullet chart in Google Sheets, as shown in this GIF:

Bullet Chart Sparkline In Google Sheets

Bullet charts are variations on bar charts that show a primary measure compared to some target value. They’re highly effective because they capture a lot of information in a small, neat design.

To begin with — a warm-up if you like — let’s create a simple version of a bullet chart using a standard sparkline. (This formula featured as Tip 237 in my weekly Google Sheets newsletter. Sign up to get a weekly actionable Google Sheets tip!)

âš¡ A template is available at the end of this post.
Continue reading Bullet Chart in Google Sheets with Sparklines and Named Functions

11 New Analytical Functions In Google Sheets For 2023

Coming hot on the heels of last year’s batch of new lambda functions, Google recently announced another group of new analytical functions for Sheets.

Included in this new batch are the long-awaited LET function, 8 new array manipulation functions, a new statistical function, and a new datetime function.

Let’s begin with a look at the new array functions. The LET function is at the end of the post.

  1. TOROW Function
  2. TOCOL Function
  3. CHOOSEROWS Function
  4. CHOOSECOLS Function
  5. WRAPROWS Function
  6. WRAPCOLS Function
  7. VSTACK Function
  8. HSTACK Function
  9. MARGINOFERROR Function
  10. EPOCHTODATE Function
  11. LET Function

Continue reading 11 New Analytical Functions In Google Sheets For 2023

XMATCH Function in Google Sheets

The XMATCH function in Google Sheets is a new lookup function in Google Sheets that finds the relative position of a search term within an array or range. It’s an evolution of the original MATCH function.

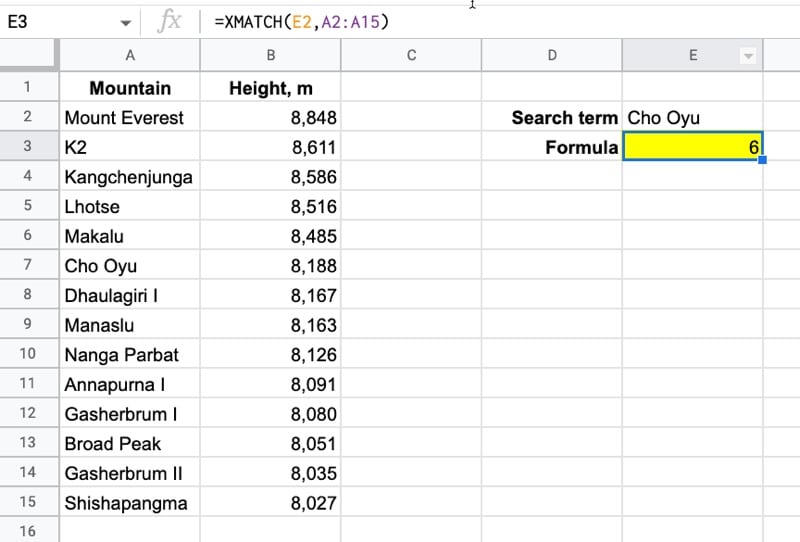
Here’s a simple XMATCH function that finds the position of the search term “Cho Oyu” in the list of the highest mountains in the world:

=XMATCH(E2,A2:A15)

In the Sheet:

Xmatch Function Google Sheets Simple Example

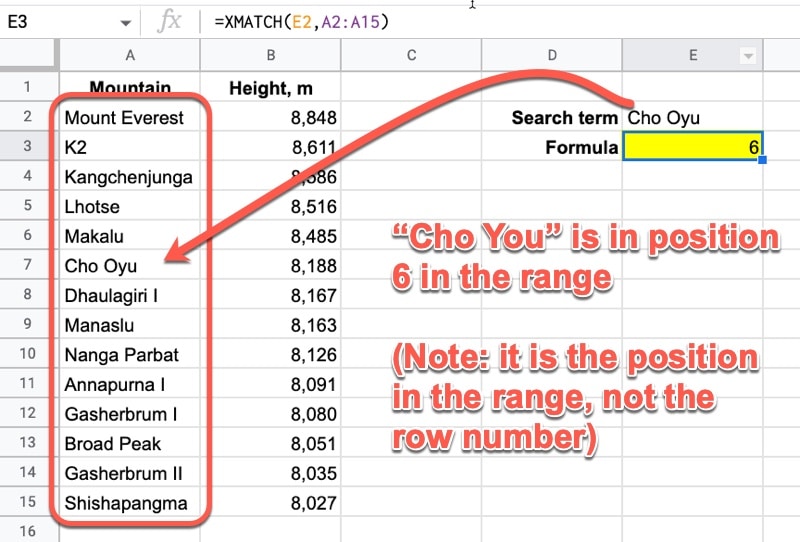
And here’s how it works:

It looks for the search term from cell E2 (“Cho Oyu”) in the range A2:A15, then returns the position of the search text within this range. Note that the result is relative to the range, irrespective of the row number.

Xmatch Function Google Sheets Explainer

Notice how, unlike a regular MATCH function, you don’t have to specify the “0” search type for an exact match. It chooses the exact match, which is by far the most common use case, by default (in contrast to the MATCH function where you have to add the 0 to explicitly confirm exact matching). More on the search types below.

🔗 Get this example and others in the template at the bottom of this article.

Continue reading XMATCH Function in Google Sheets

How To Highlight The Top 5 Values In Google Sheets With Formulas

In this post, you’ll learn how to find and highlight the top 5 values in Google Sheets.

For all the examples that follow, we’ll use this dataset, which is available in the downloadable template at the end of this post:

Example Dataset

We’ll see how to highlight the rows with the top 5 values, as well as how to extract those values using SORTN.

Continue reading How To Highlight The Top 5 Values In Google Sheets With Formulas