Goal Seek for Sheets is an Add-On for Google Sheets for doing Goal Seek type data analysis.
In October 2019, Google launched an official Add-On, called “Goal Seek for Sheets”, and it is that Add-On that this tutorial references.

Educator and Google Developer Expert. Helping you navigate the world of spreadsheets & AI.
Goal Seek for Sheets is an Add-On for Google Sheets for doing Goal Seek type data analysis.
In October 2019, Google launched an official Add-On, called “Goal Seek for Sheets”, and it is that Add-On that this tutorial references.
Editor’s Note: Strava updated their OAuth workflow (see here), which may break the code shown below.
This post looks at how to connect the Strava API with Google Sheets and create a visualization in Google Data Studio.
Strava is an insanely good app for athletes to track their workouts. I use it to track my running, biking and hiking, and look at the data over time.
This whole project was born out of a frustration with the Strava app.
Whilst it’s great for collecting data, it has some limitations in how it shows that data back to me. The training log shows all of my runs and bike rides, but nothing else. However, I do a lot of hiking too (especially when I’m nursing a running injury) and to me, it’s all one and the same. I want to see it all my activities on the same training log.
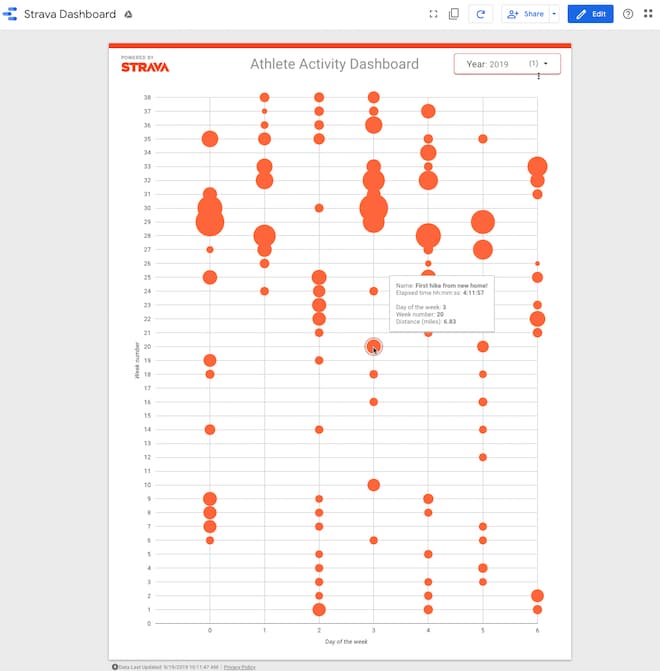
So that’s why I built this activity dashboard in Google Data Studio. It shows all of my activities, regardless of type, in a single view.
 💡 Learn more
To connect to the Strava API with Google Sheets, follow these steps:
Tools > Script editor)Strava Sheets IntegrationFile > New > Script file) and call it oauth.gsResources > Libraries...)1B7FSrk5Zi6L1rSxxTDgDEUsPzlukDsi4KGuTMorsTQHhGBzBkMun4iDFIf you’re new to API and Apps Script, check out my API Tutorial For Beginners With Google Sheets & Apps Script.
In your oauth.gs file, add this code:
var CLIENT_ID = '';
var CLIENT_SECRET = '';

// configure the service
function getStravaService() {
  return OAuth2.createService('Strava')
    .setAuthorizationBaseUrl('https://www.strava.com/oauth/authorize')
    .setTokenUrl('https://www.strava.com/oauth/token')
    .setClientId(CLIENT_ID)
    .setClientSecret(CLIENT_SECRET)
    .setCallbackFunction('authCallback')
    .setPropertyStore(PropertiesService.getUserProperties())
    .setScope('activity:read_all');
}

// handle the callback
function authCallback(request) {
  var stravaService = getStravaService();
  var isAuthorized = stravaService.handleCallback(request);
  if (isAuthorized) {
    return HtmlService.createHtmlOutput('Success! You can close this tab.');
  } else {
    return HtmlService.createHtmlOutput('Denied. You can close this tab');
  }
}
Also available in this GitHub oauth.js repo.
In your code.gs file, add this code:
// custom menu
function onOpen() {
  var ui = SpreadsheetApp.getUi();

  ui.createMenu('Strava App')
    .addItem('Get data', 'getStravaActivityData')
    .addToUi();
}

// Get athlete activity data
function getStravaActivityData() {

  // get the sheet
  var ss = SpreadsheetApp.getActiveSpreadsheet();
  var sheet = ss.getSheetByName('Sheet1');

  // call the Strava API to retrieve data
  var data = callStravaAPI();

  // empty array to hold activity data
  var stravaData = [];

  // loop over activity data and add to stravaData array for Sheet
  data.forEach(function(activity) {
    var arr = [];
    arr.push(
      activity.id,
      activity.name,
      activity.type,
      activity.distance
    );
    stravaData.push(arr);
  });

  // paste the values into the Sheet
  sheet.getRange(sheet.getLastRow() + 1, 1, stravaData.length, stravaData[0].length).setValues(stravaData);
}

// call the Strava API
function callStravaAPI() {

  // set up the service
  var service = getStravaService();

  if (service.hasAccess()) {
    Logger.log('App has access.');

    var endpoint = 'https://www.strava.com/api/v3/athlete/activities';
    var params = '?after=1546300800&per_page=200';

    var headers = {
      Authorization: 'Bearer ' + service.getAccessToken()
    };

    var options = {
      headers: headers,
      method : 'GET',
      muteHttpExceptions: true
    };

    var response = JSON.parse(UrlFetchApp.fetch(endpoint + params, options));

    return response;
  }
  else {
    Logger.log("App has no access yet.");

    // open this url to gain authorization from github
    var authorizationUrl = service.getAuthorizationUrl();

    Logger.log("Open the following URL and re-run the script: %s",
        authorizationUrl);
  }
}
Also available in this GitHub code.js repo.
Have a look at the params variable:
var params = '?after=1546300800&per_page=200'
The ‘after’ parameter means my code will only return Strava activities after the date I give. The format of the date is epoch time and the date I’ve used here is 1/1/2019 i.e. I’m only returning activities from this year.
(Here’s a handy calculator to convert human dates to epoch timestamps.)
The other part of the params variable is the ‘per_page’ variable, which I’ve set to 200. This is the maximum number of records the API will return in one batch.
To get more than 200, you need to add in the ‘page’ parameter and set it to 2,3,4 etc. to get the remaining activities, e.g.
var params = '?after=1546300800&per_page=200&page=2'
Eventually, you’ll want to do that programmatically with a while loop (keep looping while the API returns data and stop when it comes back empty-handed).
The script above parses the response from the API and adds 4 values to the array that goes into the Google Sheet, namely: ID, Name, Type, and Distance.
You can easily add more fields, however.
Look at the Strava documentation to see what fields are returned and select the ones you want. For example, you add total elevation gain like this:
activity.total_elevation_gain
If you add extra fields to the array, don’t forget to change the size of the range you’re pasting the data into in your Google Sheet.
The array and range dimensions must match.
💡 Learn moreYou need to create your app on the Strava platform so that your Google Sheet can connect to it.
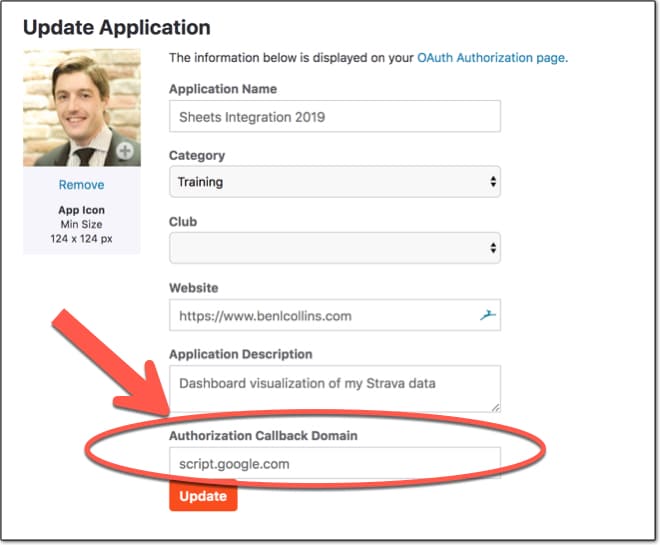
Login to Strava and go to Settings > My API Application or type in https://www.strava.com/settings/api
This will take you to the API application settings page.
Give your application a name, and enter a website and description. You can put anything you want here, as it’s just for display.
The key to unlocking the Strava API, which took me a lot of struggle to find, is to set the “Authorization Callback Domain” as
script.google.com
(Hat tip to this article from Elif T. Kuş, which was the only place I found this.)
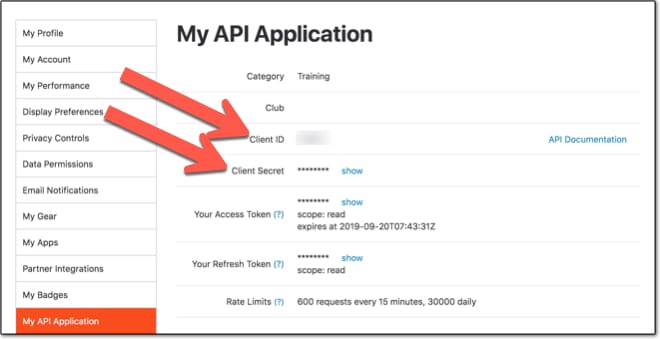
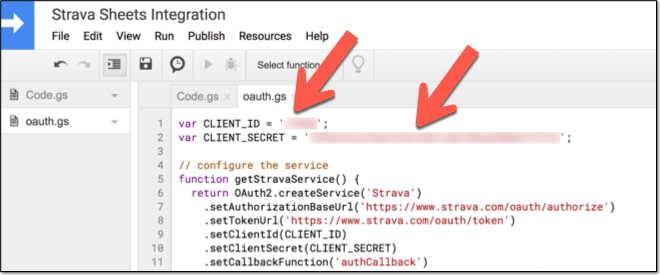
Next, grab your client ID and paste it into the CLIENT_ID variable on line 1 of your Apps Script code in the oauth.gs file.
Similarly, grab your client secret and paste it into the CLIENT_SECRET variable on line 2 of your Apps Script code in the oauth.gs file.
Copy these two values:
And paste them into your code here:
Run the onOpen function from the script editor and authorize the scopes the app needs (external service and spreadsheet app):
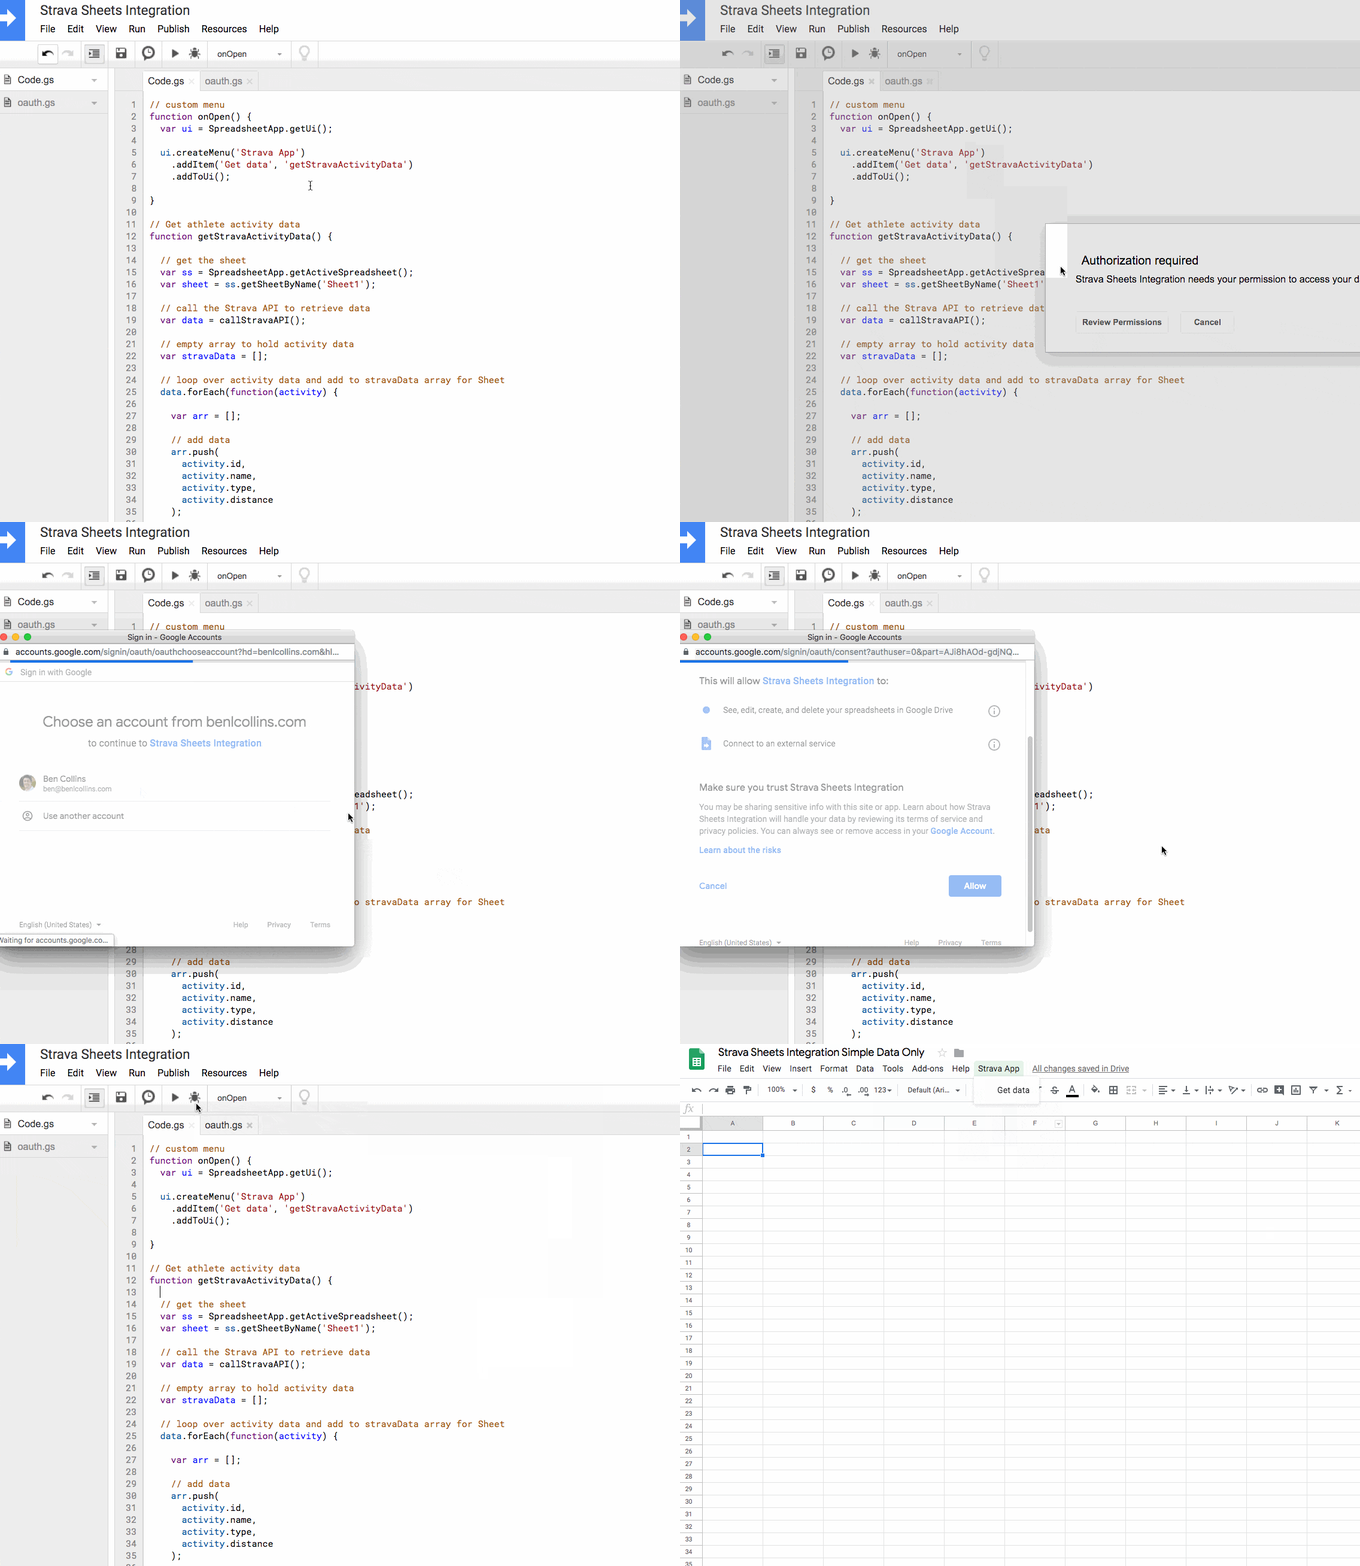
If your process doesn’t look like this, and you see a Warning sign, then don’t worry. Click the Advanced option and authorize there instead (see how in this Google Apps Script: A Beginner’s Guide).
Return to your Google Sheet and you’ll see a new custom menu option “Strava App”.
Click on it and select the “Get data” drop-down.
Nothing will happen in your Google Sheet the first time it runs.
Return to the script editor and open the logs (View > Logs). You’ll see the authorization URL you need to copy and paste into a new tab of your browser.
This prompts you to authorize the Strava app:
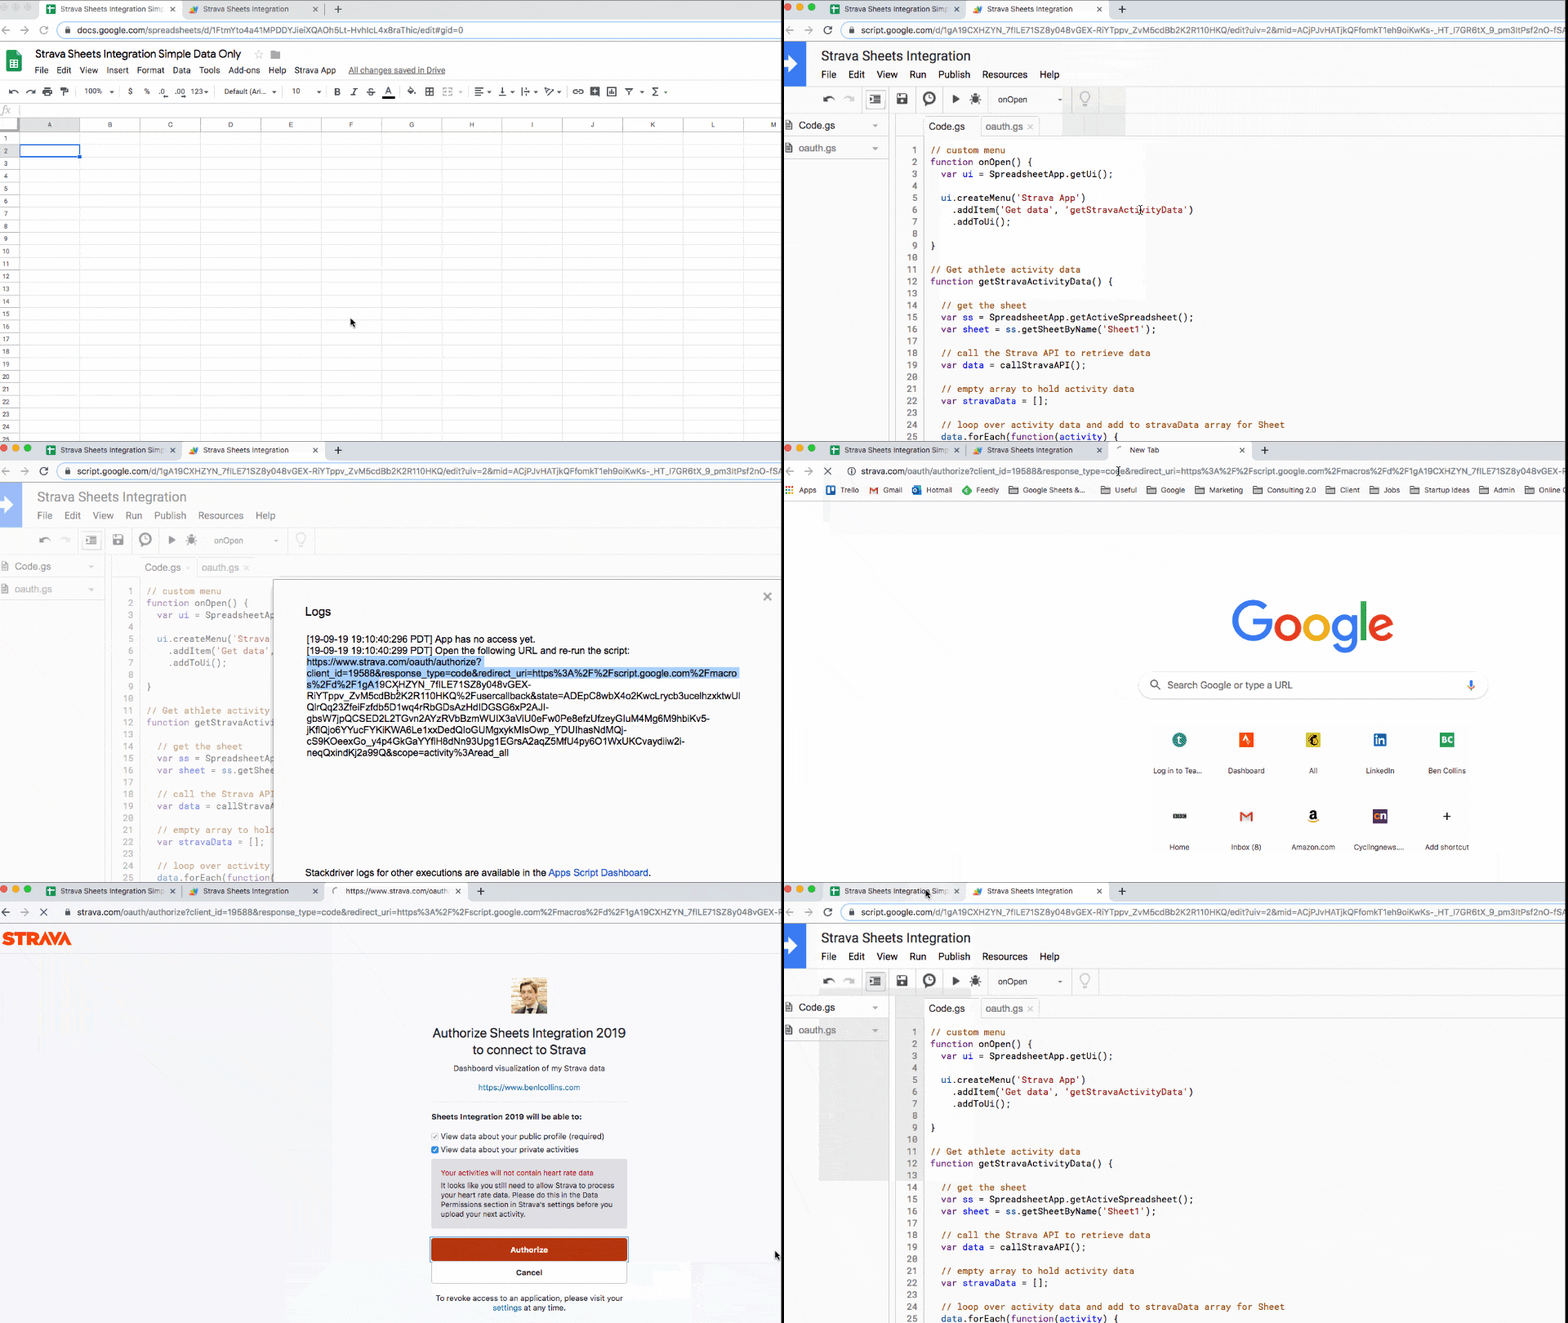
Boom! Now you’ve authenticated your application.
For another OAuth example, have a look at the GitHub to Apps Script integration which shows these steps for another application.
Now, the pièce de résistance!
Run the “Get data” function again and this time, something beautiful will happen.
Rows and rows of Strava data will appear in your Google Sheet!
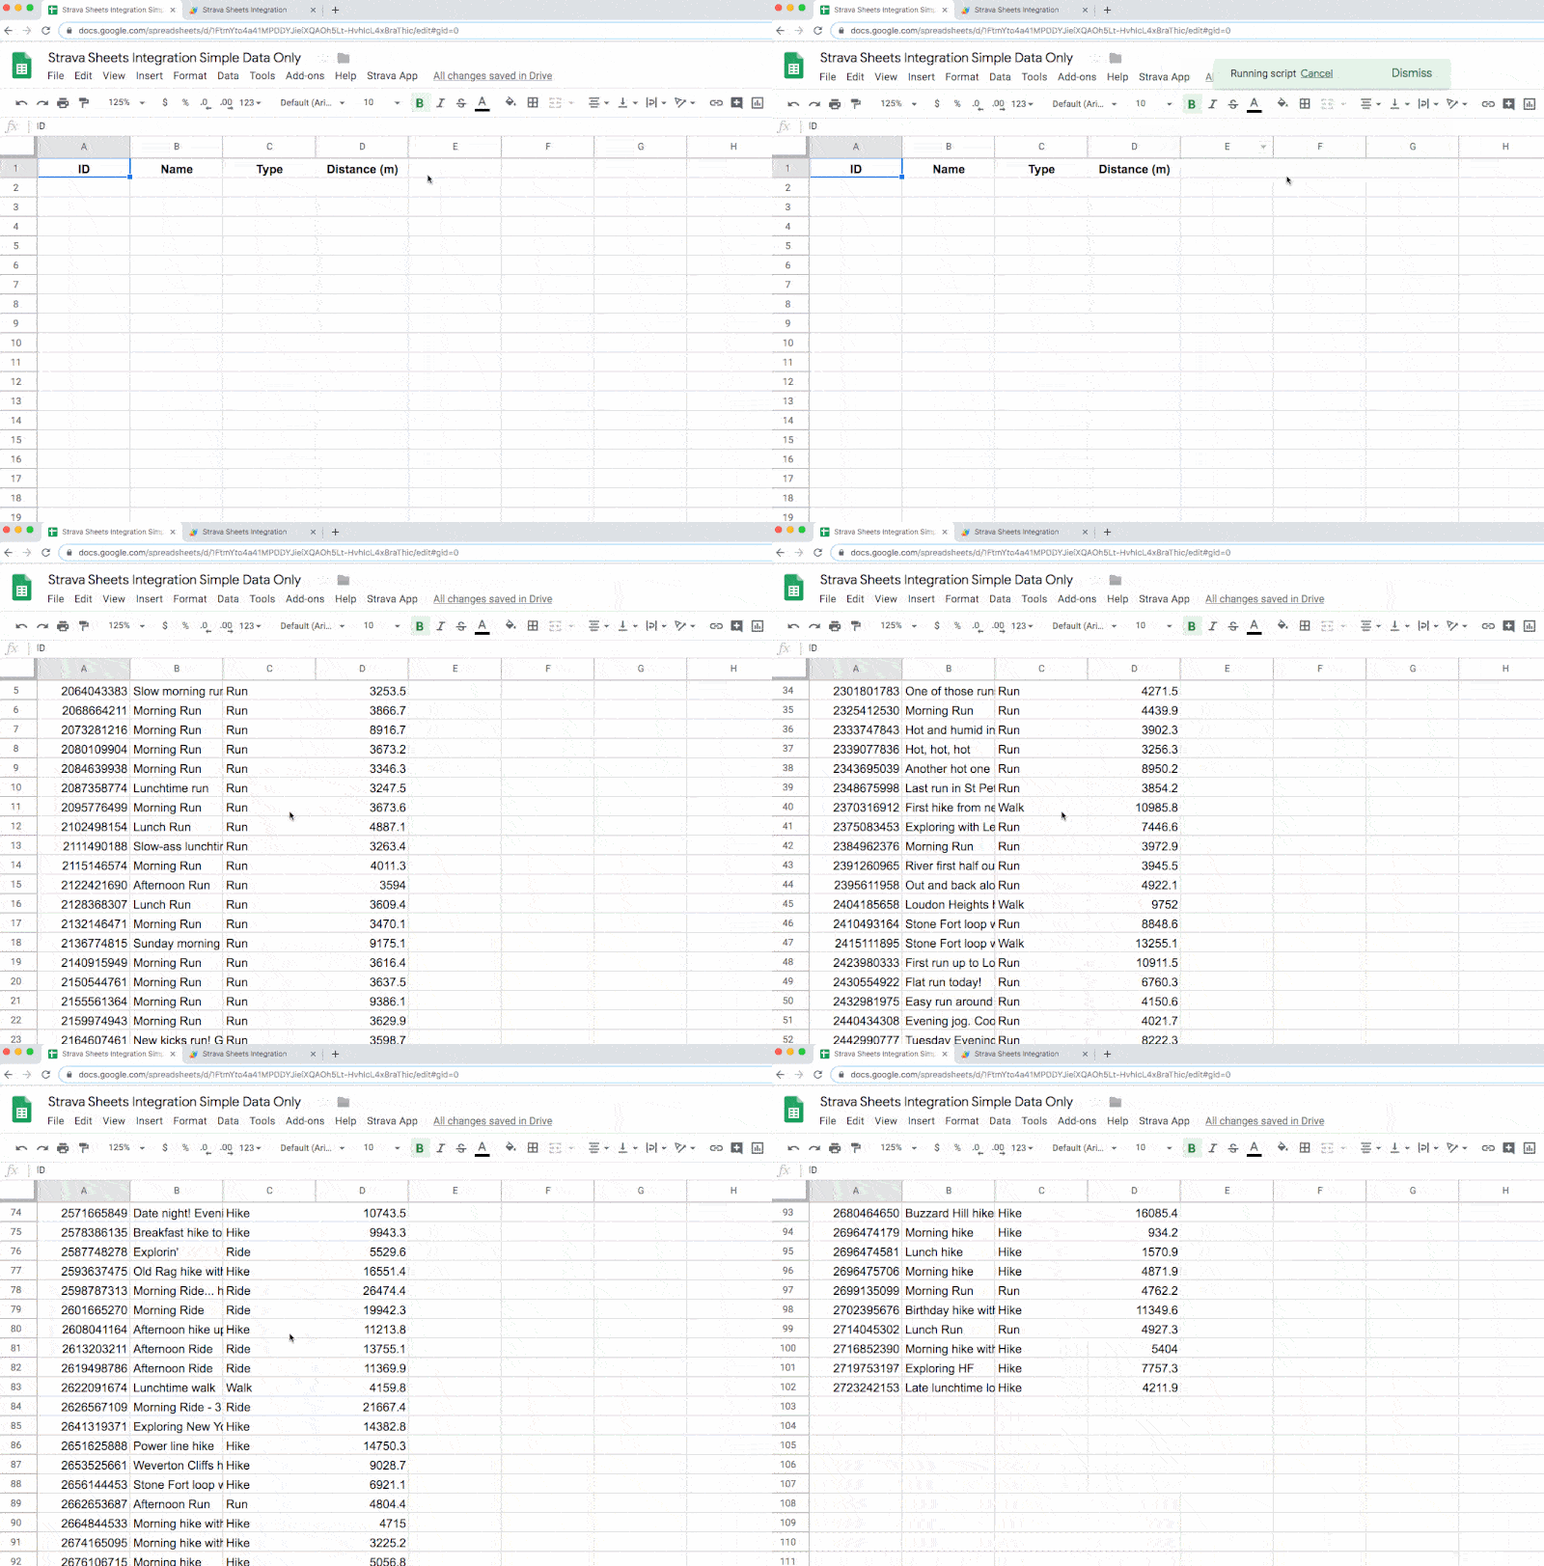
The code connects to the athlete/activities endpoint to retrieve data about all your activities.
In its present setup, shown in the GIF above, the code parses the data returned by the API and pastes 4 values into your Google Sheet: ID, Name, Type, and Distance.
(The distance is measured in meters.)
Of course, you can extract any or all of the fields returned by the API.
In the data studio dashboard, I’ve used some of the time data to determine what day of the week and what week of the year the activity occurred. I also looked at fields measuring how long the activity took.
Once you’ve established the basic connection above, you’ll probably want to set up a trigger to call the API once a day to get fresh data.
You’ll want to filter out the old data to prevent ending up with duplicate entries. You can use a filter loop to compare the new data with the values you have in your spreadsheet and discard the ones you already have.
Google Data Studio is an amazing tool for creating visually stunning dashboards.
I was motivated to build my own training log that had all of my activities showing, regardless of type.
First, I created some calculated fields in Apps Script to work out the day of the week and the week number. I added these four fields to my code.gs file:
(new Date(activity.start_date_local)).getDay(), // sunday - saturday: 0 - 6
parseInt(Utilities.formatDate(new Date(activity.start_date_local), SpreadsheetApp.getActiveSpreadsheet().getSpreadsheetTimeZone(), "w")), // week number
(new Date(activity.start_date_local)).getMonth() + 1, // add 1 to make months 1 - 12
(new Date(activity.start_date_local)).getYear() // get year
And I converted the distance in metres into a distance in miles with this modification in my Apps Script code.gs file:
(activity.distance * 0.000621371).toFixed(2), // distance in miles
From there, you simply create a new dashboard in Data Studio and connect it to your Google Sheet.
The activity log chart is a bubble chart with day of the week on the x-axis and week number as the y-axis, both set to average (so each appears separately). The bubble size is the Distance and the dimension is set to Name.
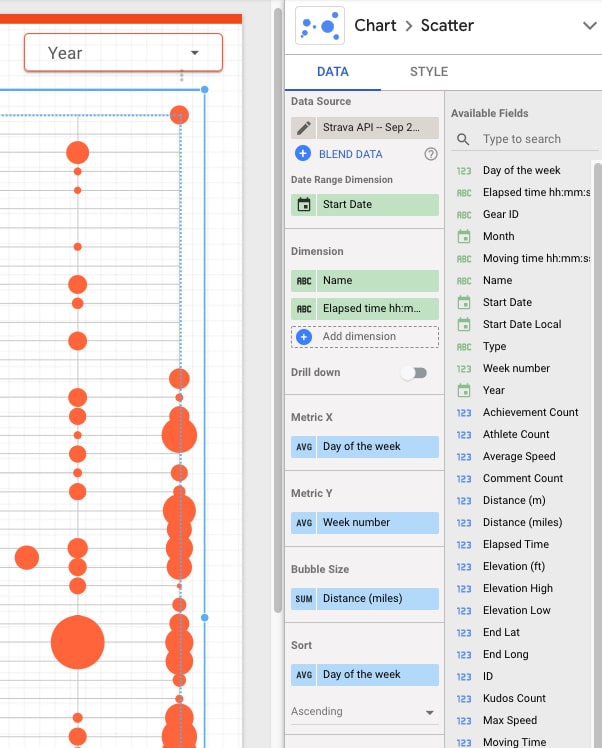
Next, I added a Year filter so that I can view each year separately (I’ve got data going back to 2014 in the dataset).
To complete the dashboard, I added a Strava logo and an orange theme.
(Note: There’s also an open source Strava API connector for Data Studio, so you could use that to create Strava visualizations and not have to write the code yourself.)
💡 Learn moreThis whole project was conceived as a way to explore the Strava API with Google Sheets. I’m happy to get it working and share it here.
However, I’ll be the first to admit that this project is still a little rough around the edges.
But I am excited to have my Strava data in a Google Sheet now. There are TONS of other interesting stories/trends that I want to explore when I have the time.
There is definitely room for improvement with the Apps Script code. In addition to those mentioned above, and with a little more time, I would bake the OAuth connection into the UI of the Google Sheet front end (using a sidebar), instead of needing to grab the URL from the Logs in your script editor.
And the Data Studio dashboard was rather hastily thrown together to solve the issue of not seeing all my activity data in one place. Again, there’s a lot more work you could do here to improve it.
Time for a run though!
 💡 Learn moreLearn how to write Apps Script and turbocharge your Google Workspace experience with the new Beginner Apps Script course
Learn how to add a Google Sheets button to run your Google Apps Script functions.
Let’s see how this works with a simple example.
Imagine you have an invoice template you use on a regular basis, but it’s a pain to clear out all the values each time you need to start over. Well, you can add a button to Google Sheets so you can run scripts and clear your invoice with a single button click.
Let’s start by creating a basic invoice template with placeholders to hold information:
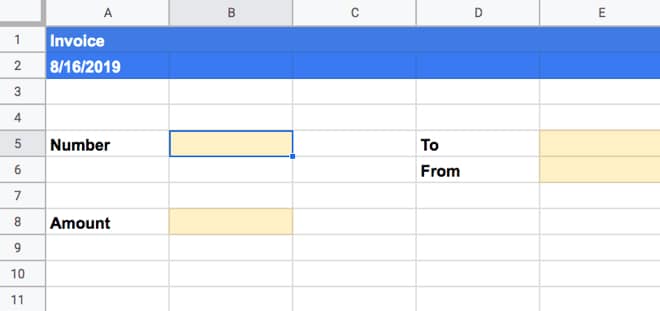
The user can enter information into cells B5, B8, E5 and E6 (shown in yellow).
In the script editor, accessed through Tools > Script Editor, add a very simple script to clear these specific cells out:
function clearInvoice() {
  const sheet = SpreadsheetApp.getActiveSheet();
  const invoiceNumber = sheet.getRange("B5").clearContent();
  const invoiceAmount = sheet.getRange("B8").clearContent();
  const invoiceTo = sheet.getRange("E5").clearContent();
  const invoiceFrom = sheet.getRange("E6").clearContent();
}
You can run this function from the script editor and it will clear out the contents of the invoice.
But that’s a pain.
You don’t want to have to open up the script editor every time. You want to do that directly from your Google Sheet.
To do that, add a Google Sheets button.
You add a button via the Insert > Drawing menu.
This brings up the drawing editor where you can easily add a box and style it to look like a button:
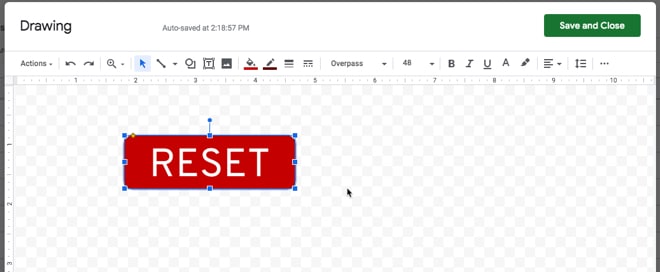
When you click Save and Close, this drawing gets added to your Google Sheet. You can click on it to resize it or drag it around to reposition it.
To assign a script, click the three little dots in the top right of the drawing and select Assign Script:
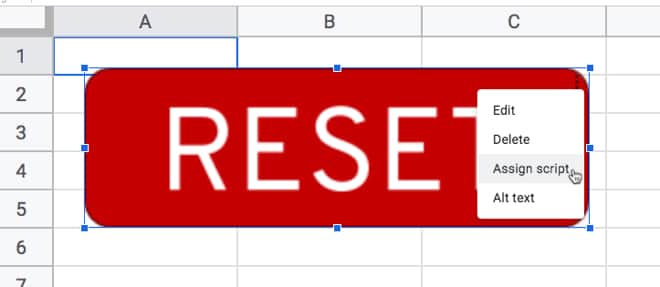
Then type in the name of the function you want to run from your Apps Script code. In this example, choose the clearInvoice function (i.e. like the code above!).
Now, when you click the button it will clear out the invoice for you!
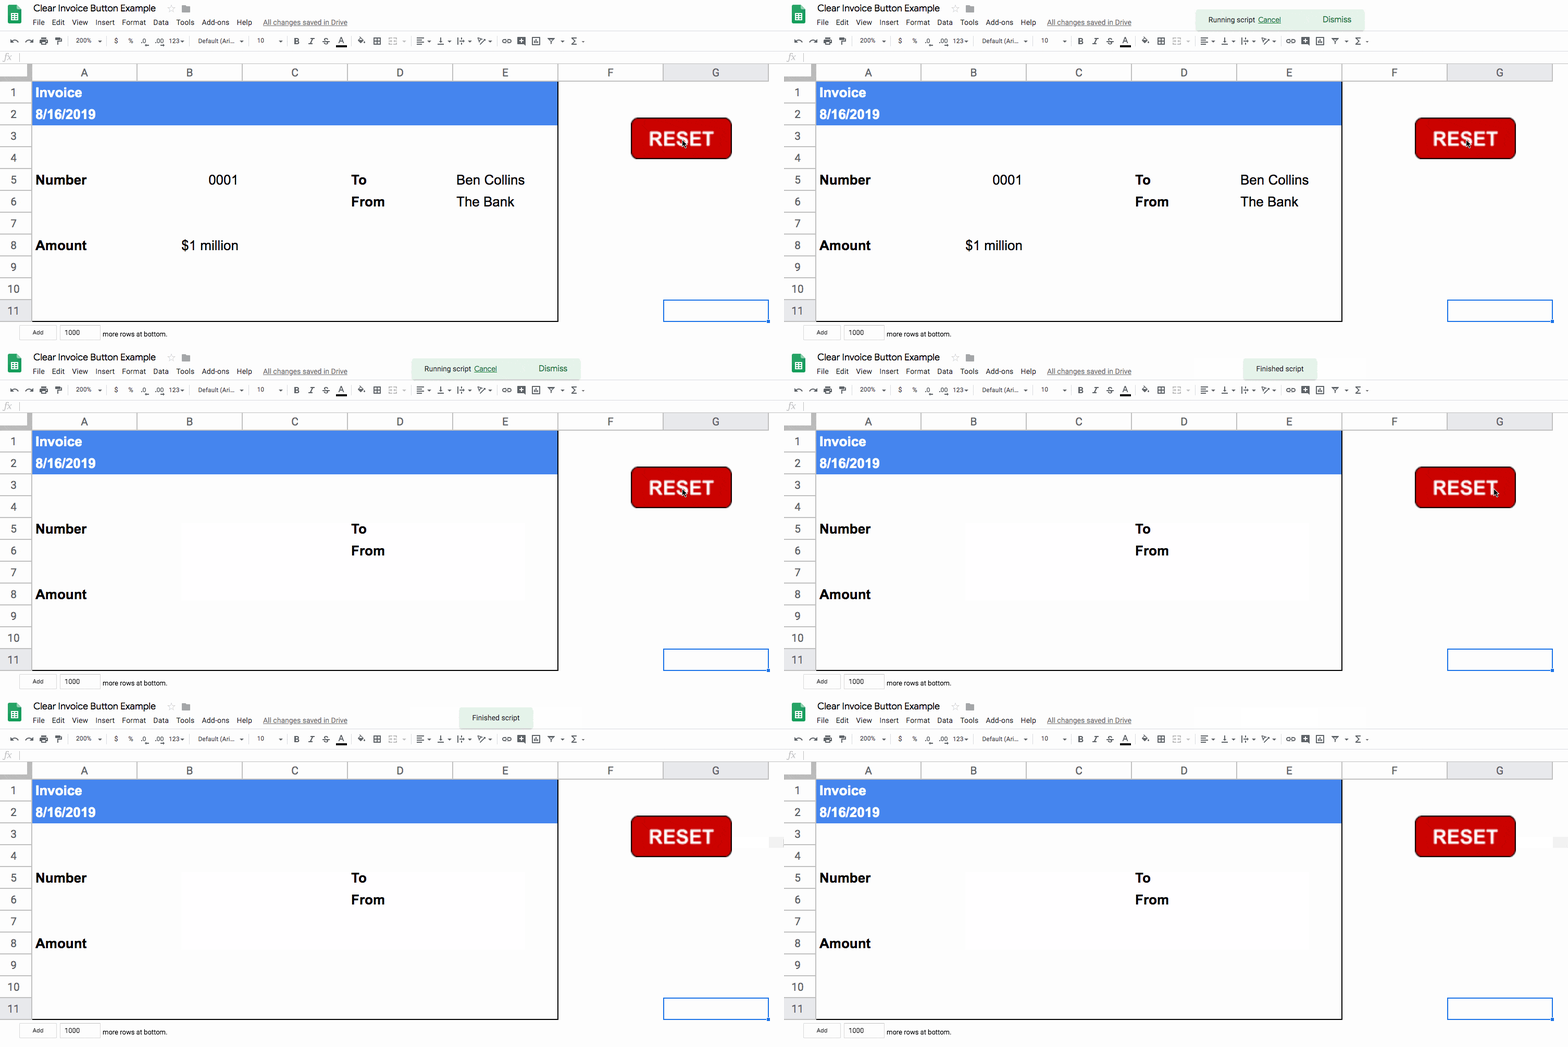
Note: to edit or move the button after you’ve assigned it to a script, you now need to right-click on it.
See Create, insert & edit drawings in the Google Documentation for more info on the Drawing feature.
💡 Learn moreIn this API tutorial for beginners, you’ll learn how to connect to APIs using Google Apps Script, to retrieve data from a third-party and display it in your Google Sheet.
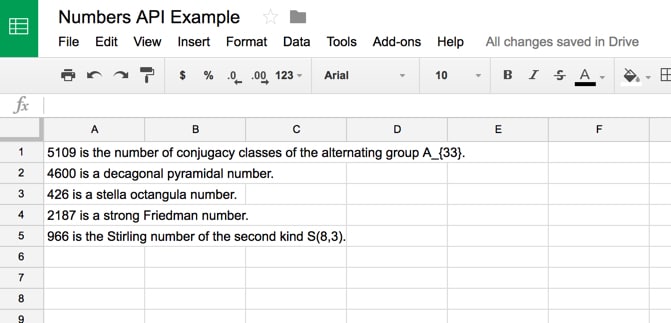
Example 1 shows you how to use Google Apps Script to connect to a simple API to retrieve some data and show it in Google Sheets:
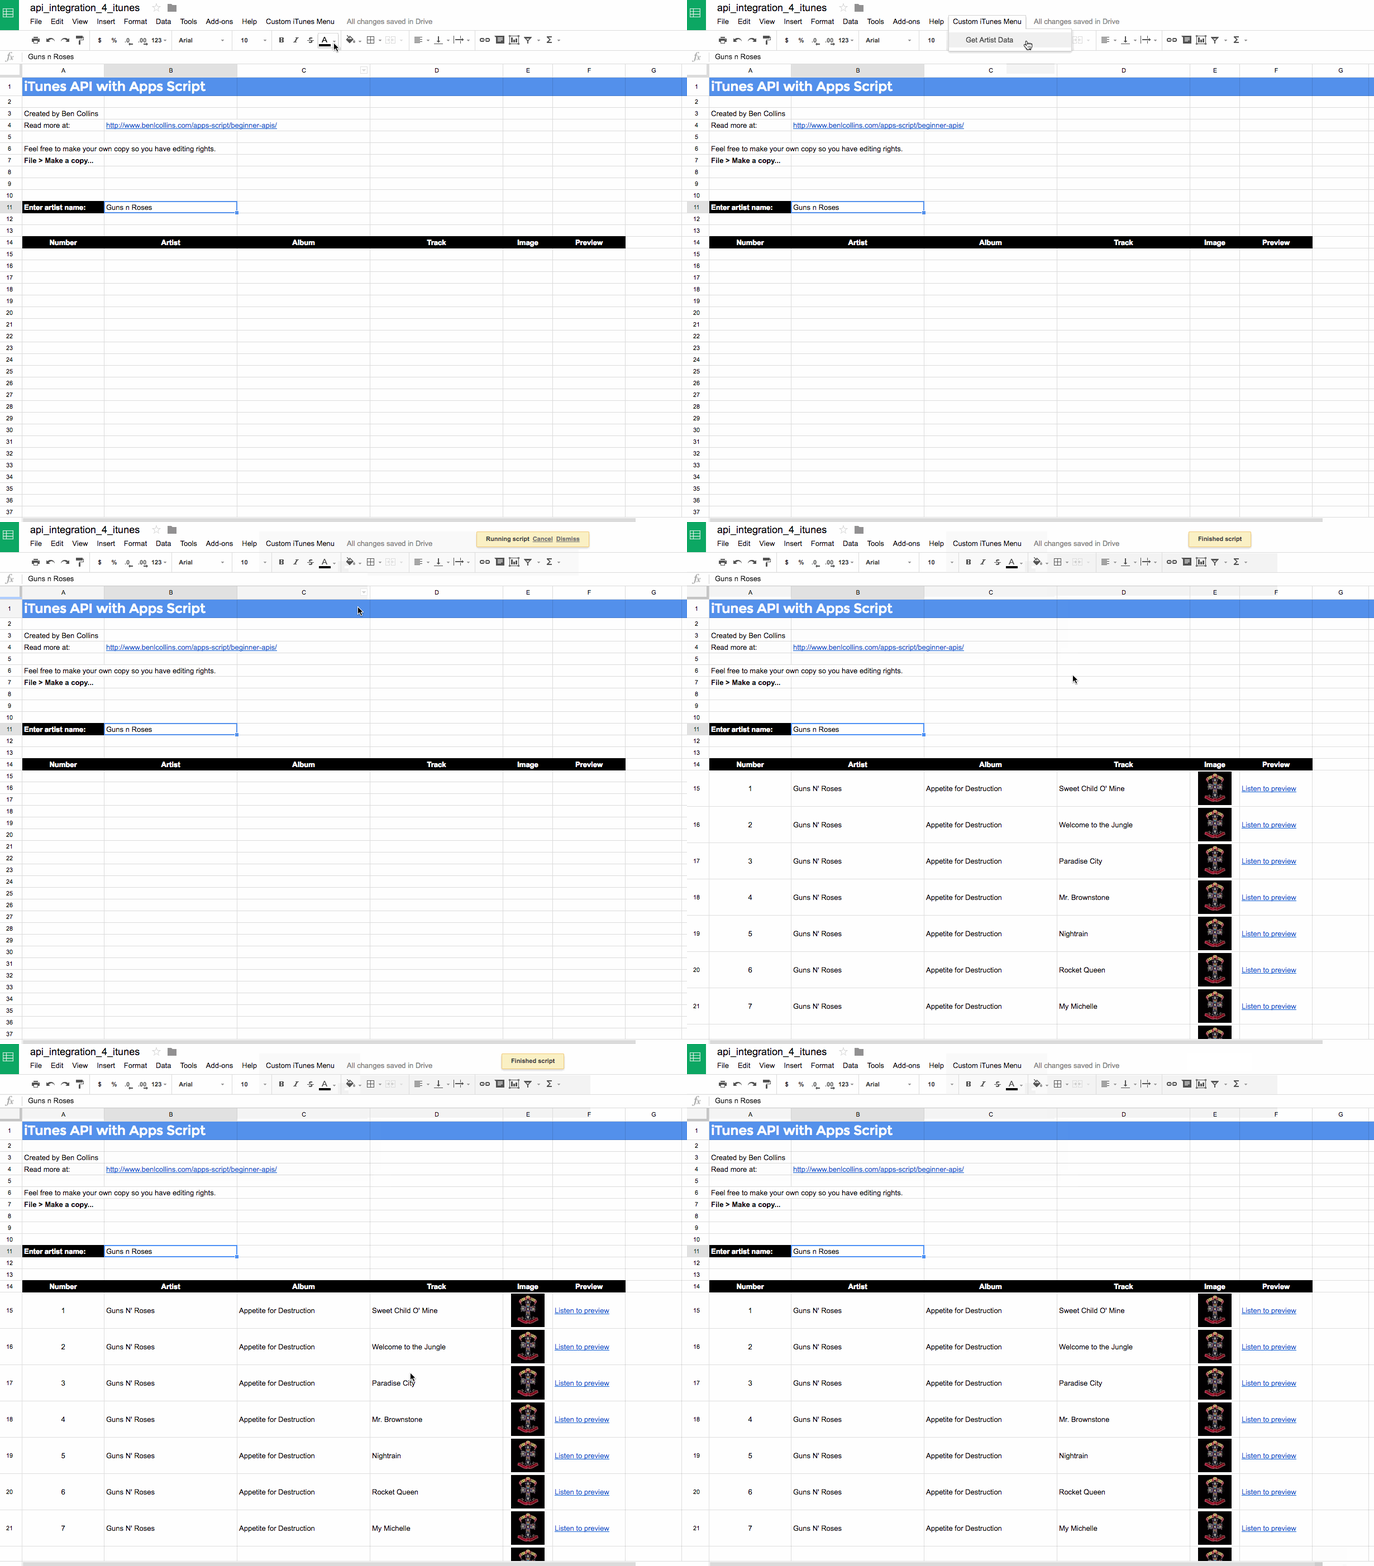
In Example 2, we’ll use Google Apps Script to build a music discovery application using the iTunes API:
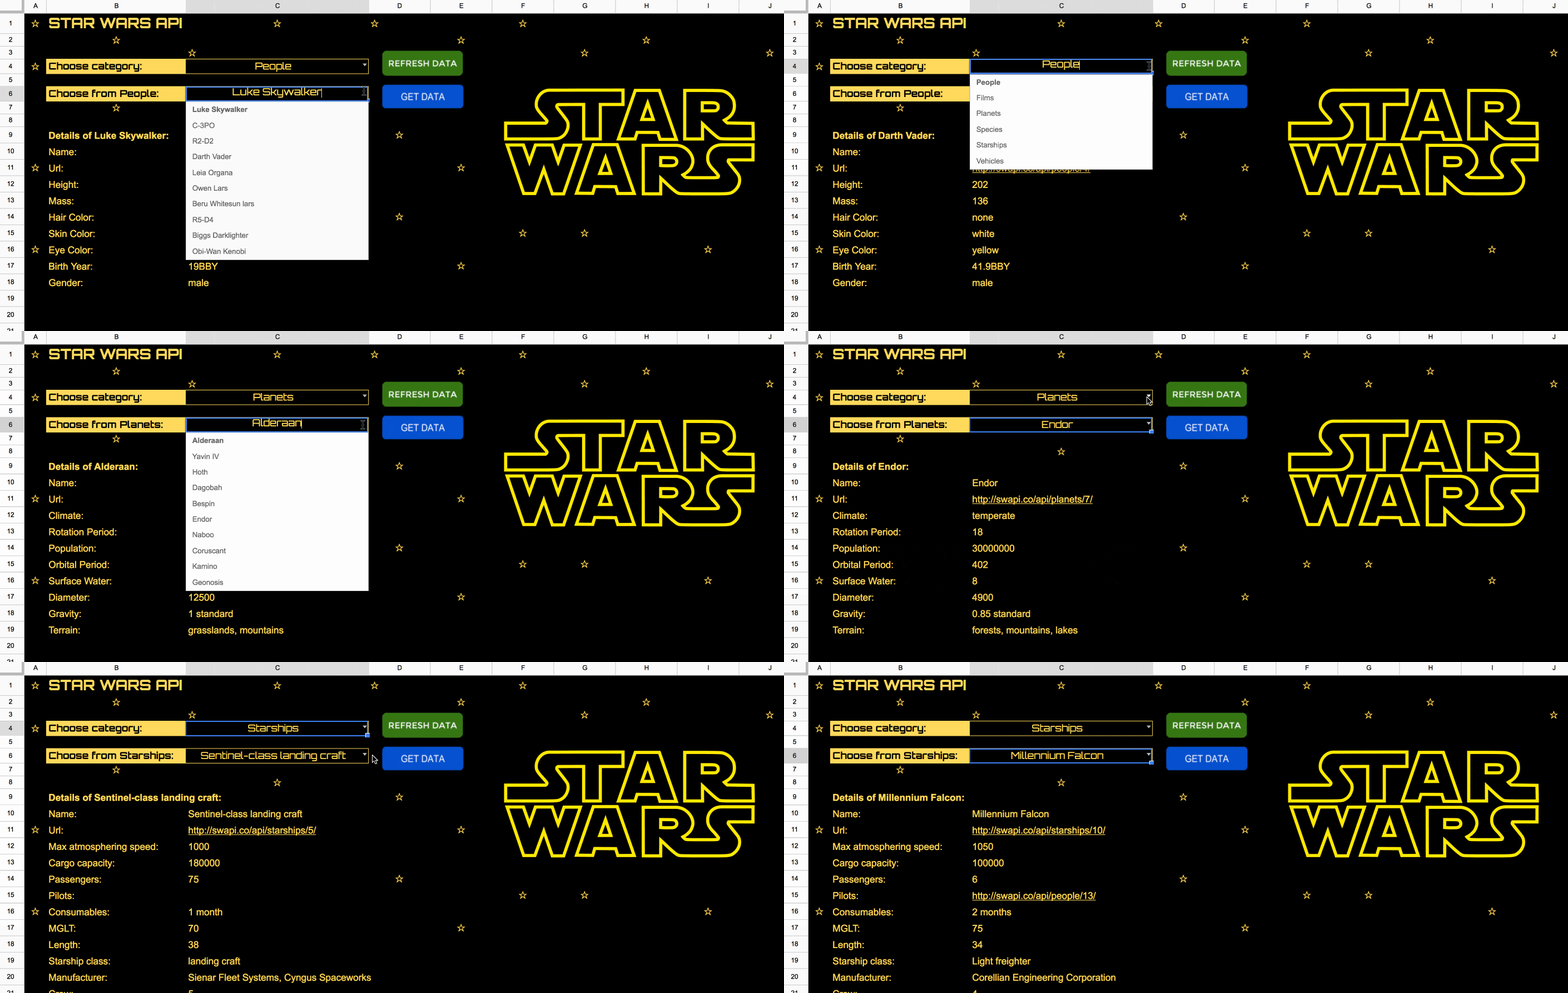
Finally, in example 3, I’ll leave you to have a go at building a Star Wars data explorer application, with a few hints:
You’ve probably heard the term API before. Maybe you’ve heard how tech companies use them when they pipe data between their applications. Or how companies build complex systems from many smaller micro-services linked by APIs, rather than as single, monolithic programs nowadays.
API stands for “Application Program Interface”, and the term commonly refers to web URLs that can be used to access raw data. Basically, the API is an interface that provides raw data for the public to use (although many require some form of API authentication).
As third-party software developers, we can access an organization’s API and use their data within our own applications.
The good news is that there are plenty of simple APIs out there, which we can cut our teeth on. We’ll see three of them in this beginner api tutorial.
We can connect a Google Sheet to an API and bring data back from that API (e.g. iTunes) into our Google Sheet using Google Apps Script. It’s fun and really satisfying if you’re new to this world.
💡 Learn moreIn this API tutorial for beginners, we’ll use Google Apps Script to connect to external APIs.
Google Apps Script is a Javascript-based scripting language hosted and run on Google servers, that extends the functionality of Google Apps.
If you’ve never used it before, check out my post: Google Apps Script: A Beginner’s Guide
Does coding fill you with dread? In that case, you can still achieve your goals using a no-code option to sync live data into Google Sheets. Check out Coefficient’s sidebar extension that offers Google Sheets connectors for CRMs, BI tools, databases, payment platforms, and more.
We’re going to start with something super simple in this beginner api tutorial, so you can focus on the data and not get lost in lines and lines of code.
Let’s write a short program that calls the Numbers API and requests a basic math fact.
Open a new blank Google Sheet and rename it: Numbers API Example
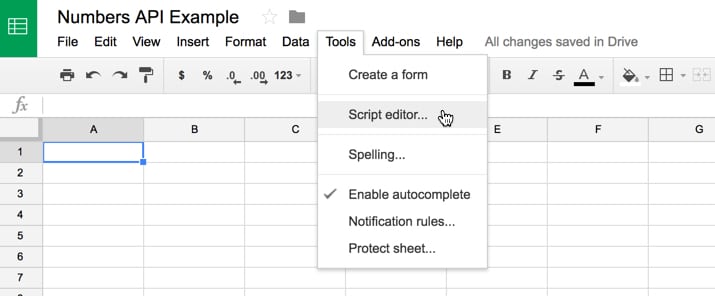
Navigate to Tools > Script Editor...
A new tab opens and this is where we’ll write our code. Name the project: Numbers API Example
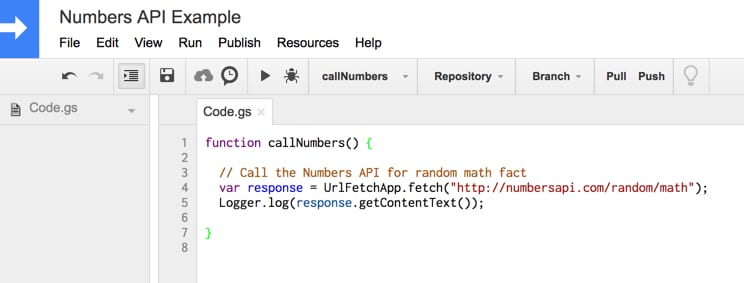
Remove all the code that is currently in the Code.gs file, and replace it with this:
function callNumbers() {

  // Call the Numbers API for random math fact
  var response = UrlFetchApp.fetch("http://numbersapi.com/random/math");
  Logger.log(response.getContentText());

}
We’re using the UrlFetchApp class to communicate with other applications on the internet to access resources, to fetch a URL.
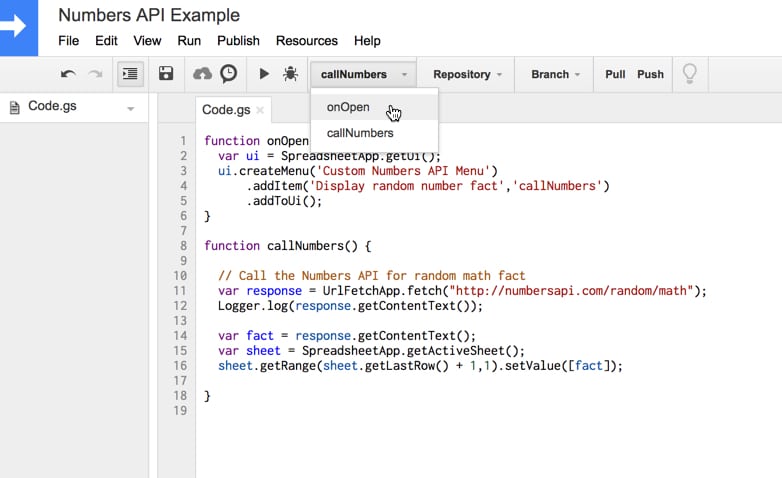
Now your code window should look like this:
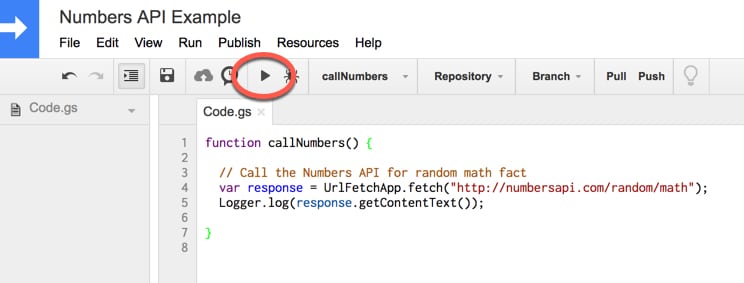
Run the function by clicking the play button in the toolbar:
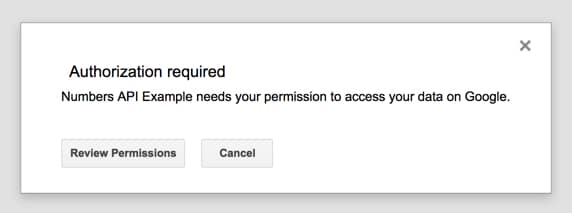
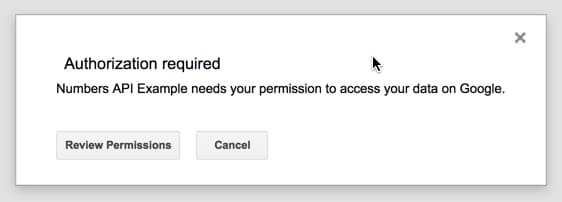
This will prompt you to authorize your script to connect to an external service. Click “Review Permissions” and then “Allow” to continue.
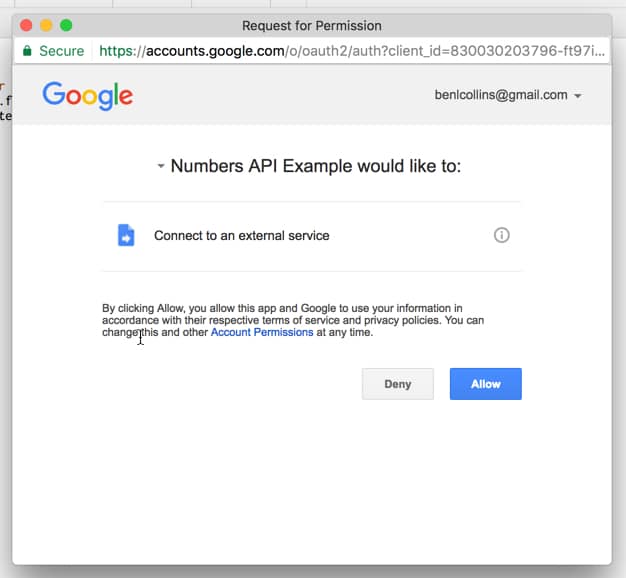
Congratulations, your program has now run. It’s sent a request to a third party for some data (in this case a random math fact) and that service has responded with that data.
But wait, where is it? How do we see that data?
Well, you’ll notice line 5 of our code above was Logger.log(....) which means that we’ve recorded the response text in our log files.
So let’s check it out.
Go to menu button Execution Log
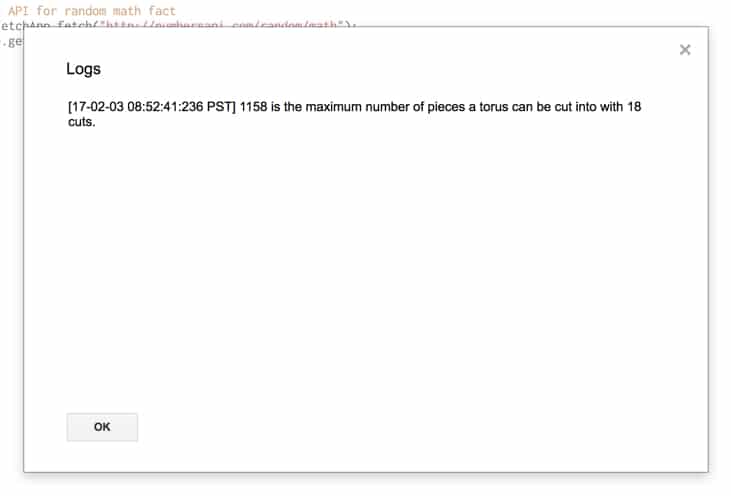
You’ll see your answer (you may of course have a different fact):
[17-02-03 08:52:41:236 PST] 1158 is the maximum number of pieces a torus can be cut into with 18 cuts.
which looks like this in the popup window:
Great! Try running it a few times, check the logs and you’ll see different facts.
Next, try changing the URL to these examples to see some different data in the response:
http://numbersapi.com/random/trivia

http://numbersapi.com/4/17/date

http://numbersapi.com/1729
You can also drop these directly into your browser if you want to play around with them. More info at the Numbers API page.
So, what if we want to print the result to our spreadsheet?
Well, that’s pretty easy.
Add these few lines of code (lines 7, 8 and 9) underneath your existing code:
function callNumbers() {

  // Call the Numbers API for random math fact
  var response = UrlFetchApp.fetch("http://numbersapi.com/random/math");
  Logger.log(response.getContentText());

  var fact = response.getContentText();
  var sheet = SpreadsheetApp.getActiveSheet();
  sheet.getRange(1,1).setValue([fact]);

}
Line 7 simply assigns the response text (our data) to a variable called fact, so we can refer to it using that name.
Line 8 gets hold of our current active sheet (Sheet1 of Numbers API Example spreadsheet) and assigns it to a variable called sheet, so that we can access it using that name.
Finally in line 9, we get cell A1 (range at 1,1) and set the value in that cell to equal the variable fact, which holds the response text.
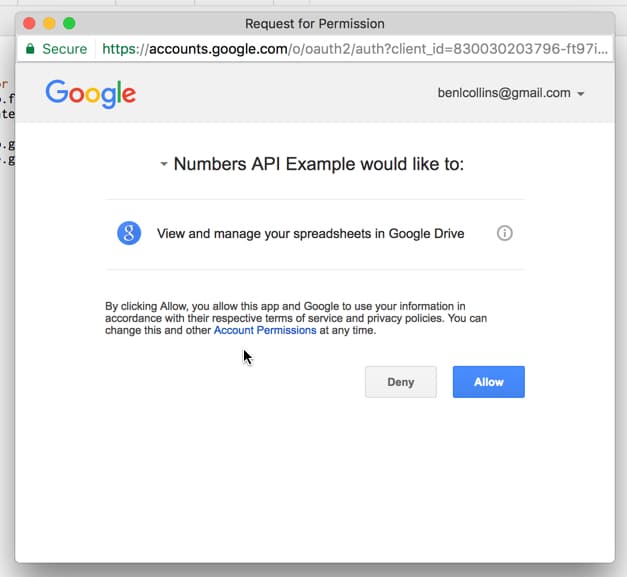
Run your program again. You’ll be prompted to allow your script to view and manage your spreadsheets in Google Drive, so click Allow:
You should now get the random fact showing up in your Google Sheet:
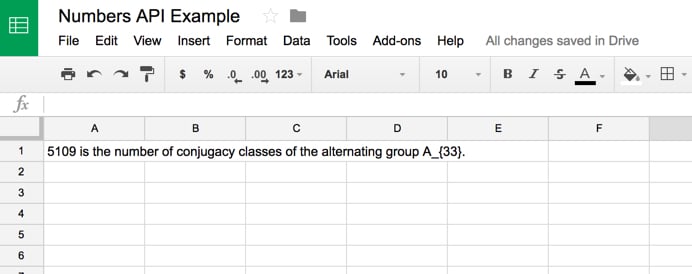
How cool is that!
To recap our progress so far in this API Tutorial for Beginners: We’ve requested data from a third-party service on the internet. That service has replied with the data we wanted and now we’ve output that into our Google Sheet!
The script as it’s written in this API Tutorial for Beginners will always overwrite cell A1 with your new fact every time you run the program. If you want to create a list and keep adding new facts under existing ones, then make this minor change to line 9 of your code (shown below), to write the answer into the first blank row:
function callNumbers() {

  // Call the Numbers API for random math fact
  var response = UrlFetchApp.fetch("http://numbersapi.com/random/math");
  Logger.log(response.getContentText());

  var fact = response.getContentText();
  var sheet = SpreadsheetApp.getActiveSheet();
  sheet.getRange(sheet.getLastRow() + 1,1).setValue([fact]);

}
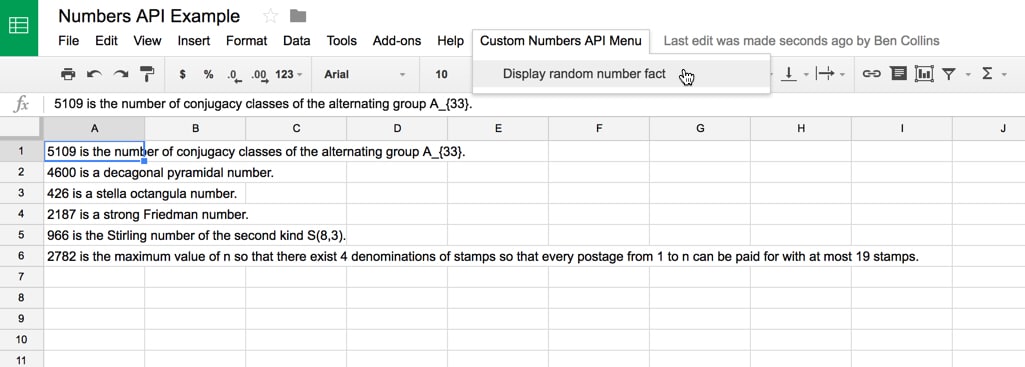
Your output now will look like this:
One last thing we might want to do with this application is add a menu to our Google Sheet, so we can run the script from there rather than the script editor window. It’s nice and easy!
Add the following code in your script editor:
function onOpen() {
  var ui = SpreadsheetApp.getUi();
  ui.createMenu('Custom Numbers API Menu')
      .addItem('Display random number fact','callNumbers')
      .addToUi();
}
Your final code for the Numbers API script should now match this code on GitHub.
Run the onOpen function, which will add the menu to the spreadsheet. We only need to do this step once.
Use the new menu to run your script from the Google Sheet and watch random facts pop-up in your Google Sheet!
Alright, ready to try something a little harder?
Let’s build ourselves a music discovery application in Google Sheets.
This application retrieves the name of an artist from the Google Sheet, sends a request to the iTunes API to retrieve information about that artist and return it. It then displays the albums, song titles, artwork and even adds a link to sample that track:
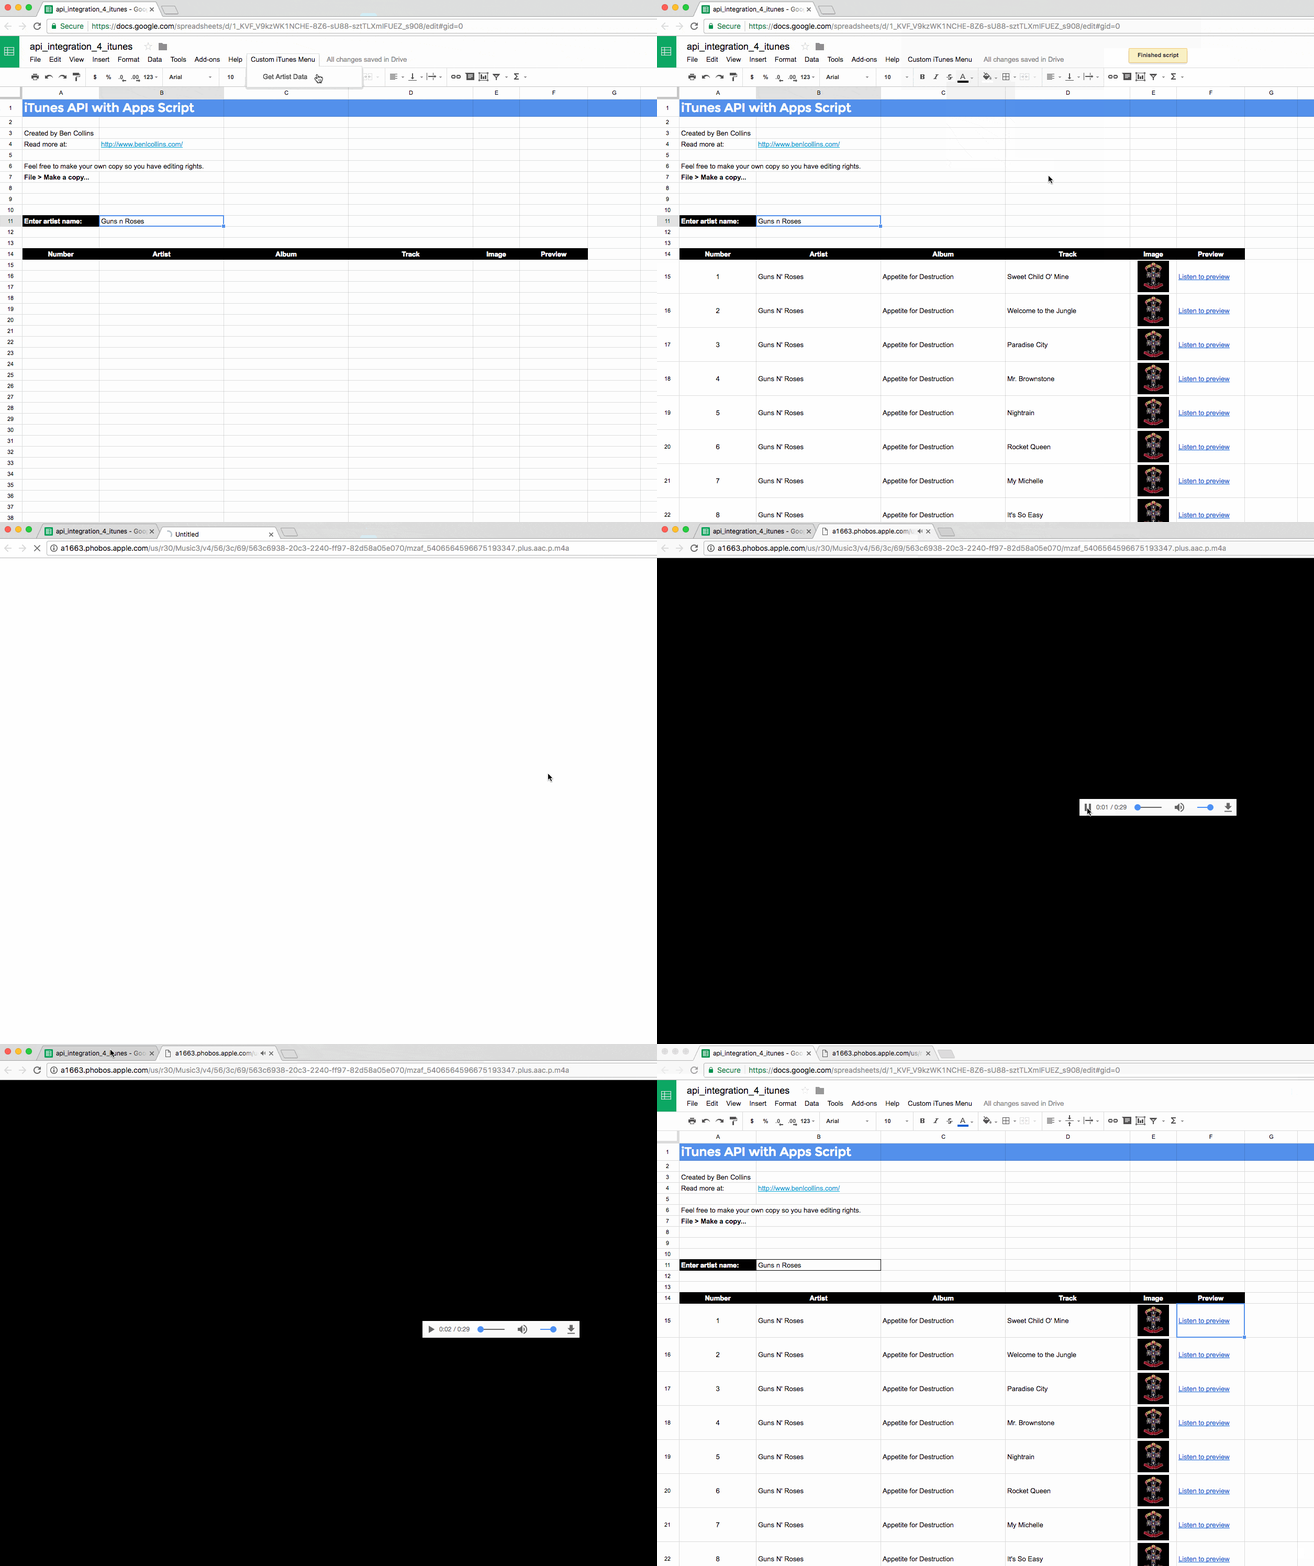
It’s actually not as difficult as it looks.
Start with a blank Google Sheet, name it “iTunes API Explorer” and open up the Google Apps Script editor.
Clear out the existing Google Apps Script code and paste in this code to start with:
function calliTunes() {

  // Call the iTunes API
  var response = UrlFetchApp.fetch("https://itunes.apple.com/search?term=coldplay");
  Logger.log(response.getContentText());
}
Run the program and accept the required permissions. You’ll get an output like this:
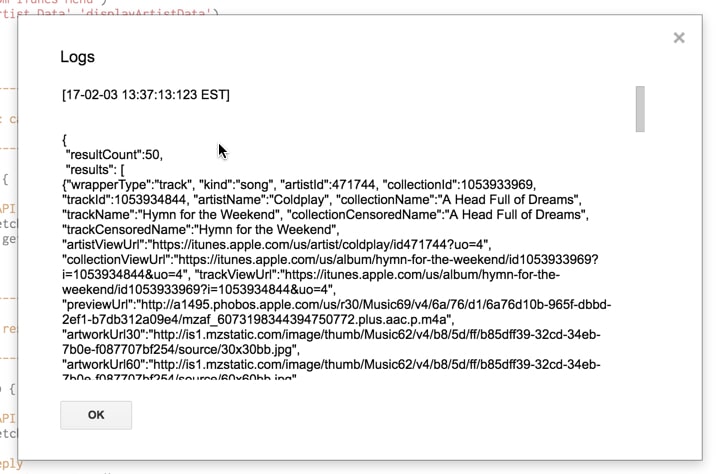
Woah, there’s a lot more data being returned this time so we’re going to need to sift through it to extract the bits we want.
So try this. Update your code to parse the data and pull out certain bits of information:
function calliTunes() {

  // Call the iTunes API
  var response = UrlFetchApp.fetch("https://itunes.apple.com/search?term=coldplay");

  // Parse the JSON reply
  var json = response.getContentText();
  var data = JSON.parse(json);

  Logger.log(data);
  Logger.log(data["results"]);
  Logger.log(data["results"][0]);
  Logger.log(data["results"][0]["artistName"]);
  Logger.log(data["results"][0]["collectionName"]);
  Logger.log(data["results"][0]["artworkUrl60"]);
  Logger.log(data["results"][0]["previewUrl"]);

}
Line 4: We send a request to the iTunes API to search for Coldplay data. The API responds with that data and we assign it to a variable called response, so we can use that name to refer to it.
Lines 7 and 8: We get the context text out of the response data and then parse the JSON string response to get the native object representation. This allows us to extract out different bits of the data.
So, looking first at the data object (line 10):
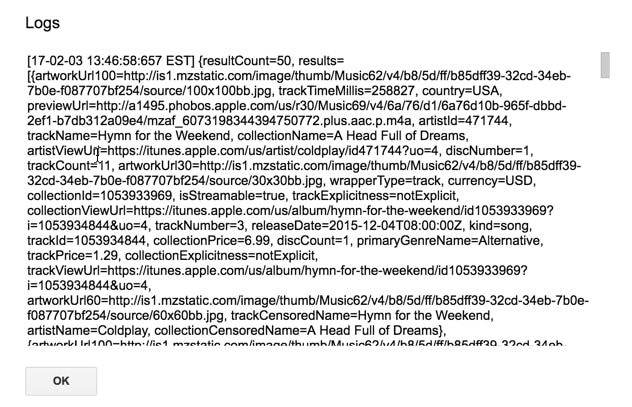
You can see it’s an object with the curly brace at the start {
The structure is like this:
{

resultCount = 50,

results = [ ....the data we're after... ]
}
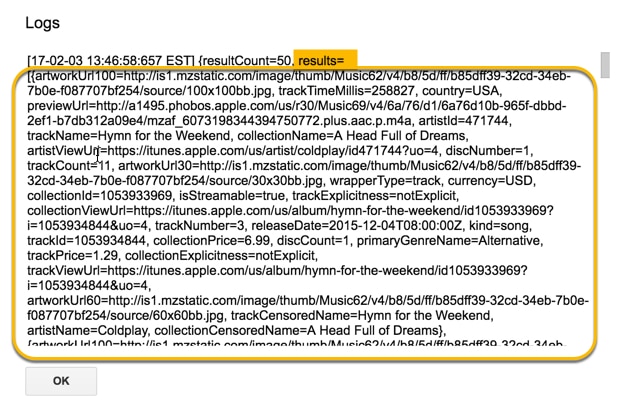
Line 11: we extract the “results”, which is the piece of data that contains the artist and song information, using:
data["results"]
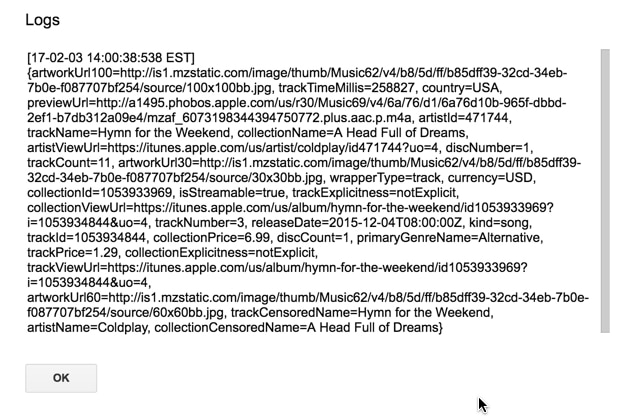
Line 12: There are multiple albums returned for this artist, so we grab the first one using the [0] reference since the index starts from 0:
data["results"][0]
This shows all of the information available from the iTunes API for this particular artist and album:
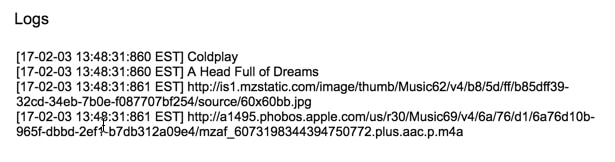
Lines 13 – 16: Within this piece of data, we can extract specific details we want by referring to their names:
e.g. data["results"][0]["collectionName"]
to give the following output:
Use comments (“//” at the start of a line) to stop the Logger from logging the full data objects if you want. i.e. change lines 10, 11 and 12 to be:
// Logger.log(data);
// Logger.log(data[“results”]);
// Logger.log(data[“results”][0]);
This will make it easier to see the details you’re extracting.
If we want to build the application that’s showing in the GIF at the top of this post, then there are a few steps we need to go through:
It’s always a good idea to write out a plan like this before you commit to writing any lines of code.
That way you can think through the whole application and what it’s going to do, which allows you to make efficient choices with how you setup your code.
So the first thing to do is setup a Google Sheet. I’ll leave this up to you, but here’s a screenshot of my basic Google Sheet setup:
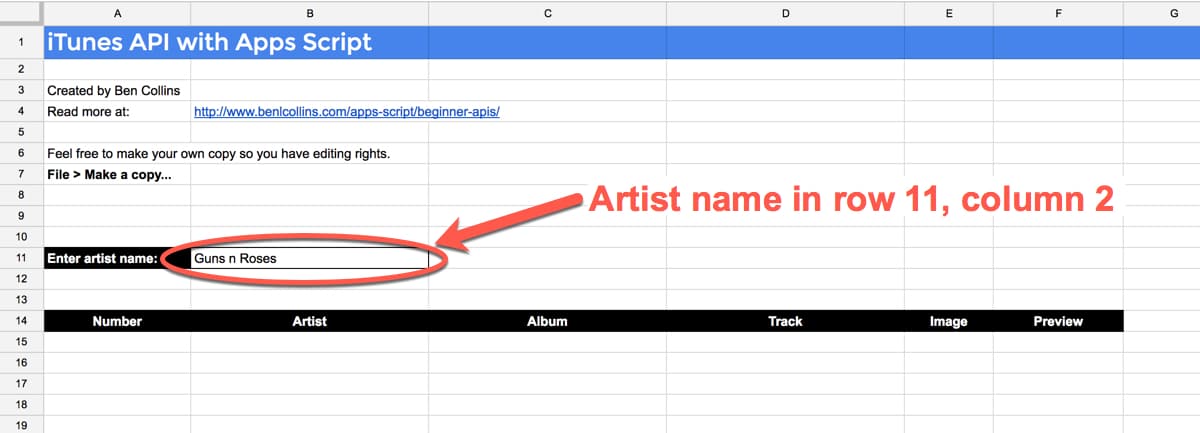
The important thing to note is the location of the cell where a user types in the artist name (11th row, 2nd column) as we’ll be referring to that in our code.
And here’s the Google Apps Script code for our application:
// --------------------------------------------------------------------------------------------------
//
// iTunes Music Discovery Application in Google Sheets
//
// --------------------------------------------------------------------------------------------------

// custom menu
function onOpen() {
  var ui = SpreadsheetApp.getUi();
  ui.createMenu('Custom iTunes Menu')
      .addItem('Get Artist Data','displayArtistData')
      .addToUi();
}

// function to call iTunes API
function calliTunesAPI(artist) {

  // Call the iTunes API
  var response = UrlFetchApp.fetch("https://itunes.apple.com/search?term=" + artist + "&limit=200");

  // Parse the JSON reply
  var json = response.getContentText();
  return JSON.parse(json);

}


function displayArtistData() {

  // pick up the search term from the Google Sheet
  var ss = SpreadsheetApp.getActiveSpreadsheet();
  var sheet = ss.getActiveSheet();

  var artist = sheet.getRange(11,2).getValue();

  var tracks = calliTunesAPI(artist);

  var results = tracks["results"];

  var output = []

  results.forEach(function(elem,i) {
    var image = '=image("' + elem["artworkUrl60"] + '",4,60,60)';
    var hyperlink = '=hyperlink("' + elem["previewUrl"] + '","Listen to preview")';
    output.push([elem["artistName"],elem["collectionName"],elem["trackName"],image,hyperlink]);
    sheet.setRowHeight(i+15,65);
  });

  // sort by album
  var sortedOutput = output.sort( function(a,b) {

    var albumA = (a[1]) ? a[1] : 'Not known';  // in case album name undefined
    var albumB = (b[1]) ? b[1] : 'Not known';  // in case album name undefined

    if (albumA < albumB) { return -1; } else if (albumA > albumB) {
      return 1;
    }
    // names are equal
    return 0;
  });

  // adds an index number to the array
  sortedOutput.forEach(function(elem,i) {
    elem.unshift(i + 1);
  });

  var len = sortedOutput.length;

  // clear any previous content
  sheet.getRange(15,1,500,6).clearContent();

  // paste in the values
  sheet.getRange(15,1,len,6).setValues(sortedOutput);

  // formatting
  sheet.getRange(15,1,500,6).setVerticalAlignment("middle");
  sheet.getRange(15,5,500,1).setHorizontalAlignment("center");
  sheet.getRange(15,2,len,3).setWrap(true);

}
Here’s the iTunes API script file on GitHub.
Let’s talk about a few of the key lines of code in this program:
Lines 16 – 25 describe a function that takes an artist name, calls the API with this artist name and then returns the search results from the API. I’ve encapsulated this as a separate function so I can potentially re-use it elsewhere in my program.
The main program starts on line 28.
On line 34, I retrieve the name of the artist that has been entered on the Google Sheet, and we call our API function with this name on line 36.
On lines 42 – 47, I take the results returned by the API, loop over them and pull out just the details I want (artist name, album name, song title, album artwork and preview track). I push all of this into a new array called output.
Next I sort and add an index to the array, although both of these are not mandatory steps.
On line 68, I clear out any previous content in my sheet.
Then on line 71, I paste in the new data, starting at row 15.
Finally, lines 74 – 76 format the newly pasted data, so that the images have space to show properly.
Run the onOpen() function from the script editor once to add the custom menu to your Google Sheet. Then you’ll be able to run your iTunes code from the Google Sheet:
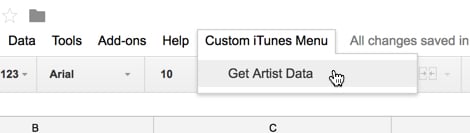
Now you can run the program to search for your favorite artist!
Documentation for searching the iTunes Store.
Documentation showing the search results JSON packet.
This one is a lot of fun! Definitely the most fun example in this API Tutorial for Beginners.
The Star Wars API is a database of all the films, people, planets, starships, species and vehicles in the Star Wars films. It’s super easy to query and the returned data is very friendly.
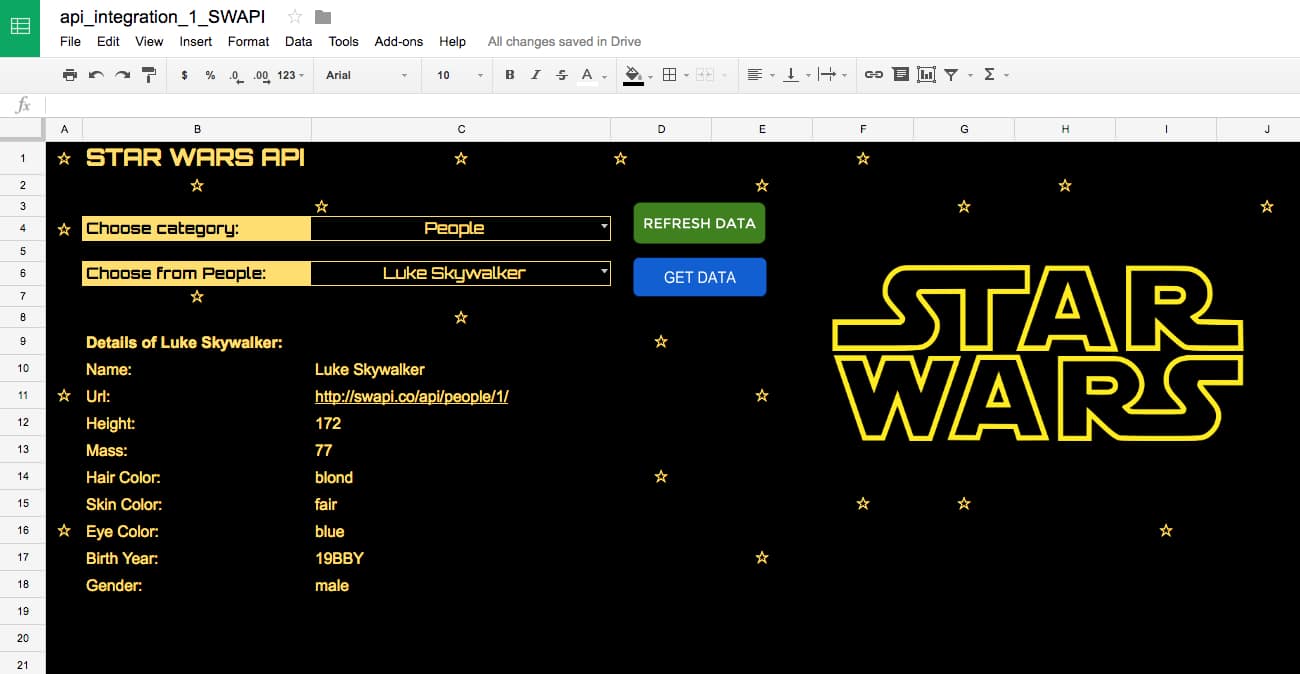
It’s a little easier than the iTunes API because the data returned is smaller and more manageable, and therefore easier to parse when you first get hold of it.
As with both the previous APIs, start with a simple call to see what the API returns:
/*
 * Step 1:
 * Most basic call to the API
 */
function swapi() {

  // Call the Star Wars API
  var response = UrlFetchApp.fetch("http://swapi.dev/api/planets/1/");
  Logger.log(response.getContentText());
}
The data returned looks like this:
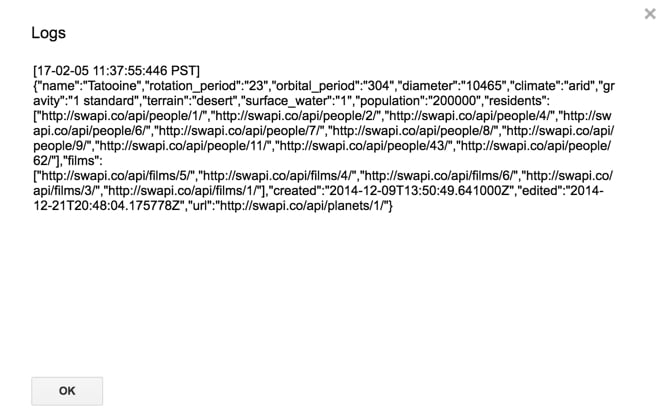
So, it’s relatively easy to get the different pieces of data you want, with code like this:
/*
 * Step 2:
 * Same basic call to the API
 * Parse the JSON reply
 */
function swapi() {

  // Call the Star Wars API
  var response = UrlFetchApp.fetch("http://swapi.dev/api/planets/1/");

  // Parse the JSON reply
  var json = response.getContentText();
  var data = JSON.parse(json);
  Logger.log(data);
  Logger.log(data.name);
  Logger.log(data.population);
  Logger.log(data.terrain);
}
Well, that should be enough of a hint for you to give this one a go!
In addition to custom menus to run scripts from your Google Sheet, you can add Google Sheets buttons and connect them to a script to run the script when they are clicked. That’s what I’ve done in this example.
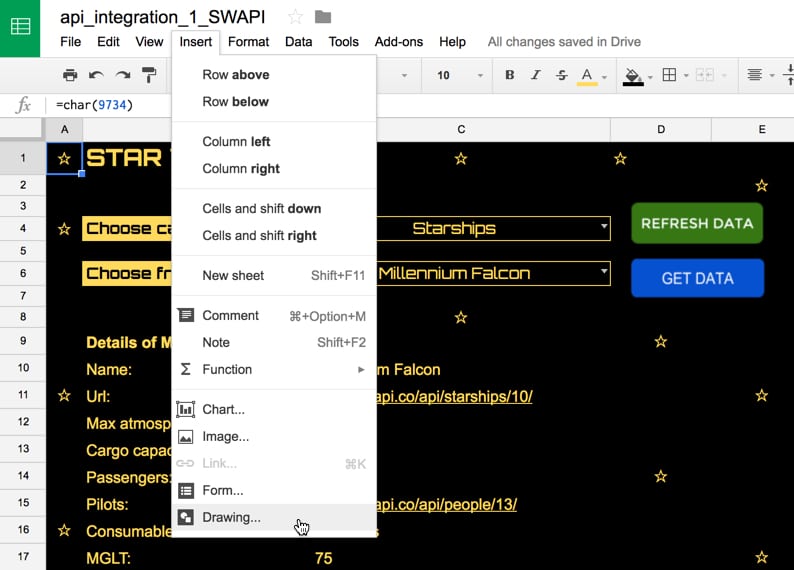
On the menu, Insert > Drawing...
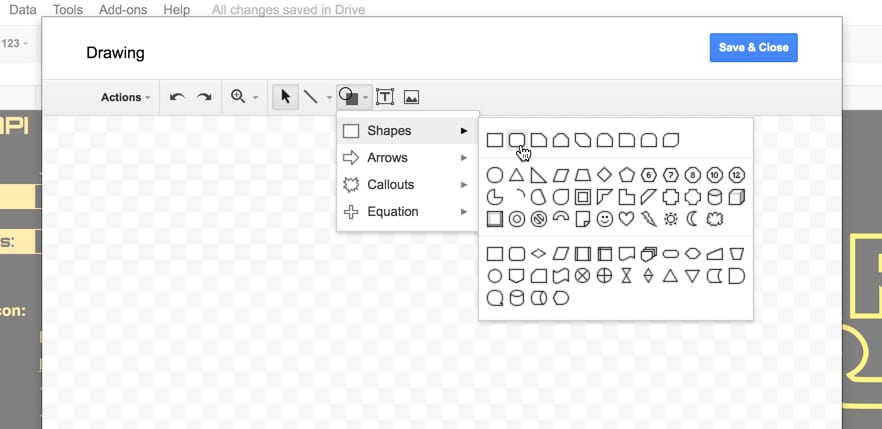
Create a button using the rectangle tool:
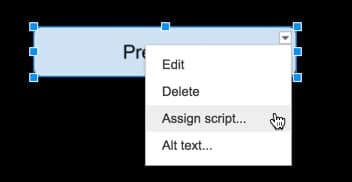
Finally, right click the drawing when it’s showing in your sheet, and choose Assign Script and type in the name of the function you want to run:
What else?
Use this CHAR formula to add stars to your Google Sheet:
=CHAR(9734)I used the font “Orbitron” across the whole worksheet and, whilst it’s not a Star Wars font, it still has that space-feel to it.
The big Star Wars logo is simply created by merging a bunch of cells and using the IMAGE() formula with a suitable image from the web.
Finally, here’s my SWAPI script on GitHub if you want to use it.
💡 Learn moreHere are a few other beginner-friendly APIs to experiment with:
> Giphy API. Example search endpoint: Funny cat GIFs
> Pokémon API. Example search endpoint: Pokemon no. 1
> Open Movie Database API. Example search endpoint: Batman movies
> International Space Station Current Location. Example search endpoint: ISS current location
Also, here’s the official Google documentation on connecting to external APIs.
Finally, here’s a syntax guide for the common forms of API Authentication using Apps Script.
Let me know in the comments what you do with all these different APIs!
Disclosure: Some of the links in this post are affiliate links, meaning I’ll get a small commission if you click the link and subsequently signup to use that vendor’s service. I only do this for tools I use myself and wholeheartedly recommend.
Slicers in Google Sheets are a powerful way to filter data in Pivot Tables.
They make it easy to change values in Pivot Tables and Charts with a single click. Slicers are extremely useful when building dashboards in Google Sheets.