In this tutorial, you’ll use Apps Script to build a tool called Sheet Sizer, to measure the size of your Google Sheets!
Google Sheets has a limit of 10 million cells, but it’s hard to know how much of this space you’ve used.
Sheet Sizer will calculate the size of your Sheet and compare it to the 10 million cell limit in Google Sheets.
Sheet Sizer: Build a sidebar to display information
Step 1:
Open a blank sheet and rename it to “Sheet Sizer”
Step 2:
Open the IDE. Go to Tools > Script editor
Step 3:
Rename your script file “Sheet Sizer Code”
Step 4:
In the Code.gs file, delete the existing “myFunction” code and copy in this code:
/**
* Add custom menu to sheet
*/
function onOpen() {

  SpreadsheetApp.getUi()
    .createMenu('Sheet Sizer')
    .addItem('Open Sheet Sizer', 'showSidebar')
    .addToUi();
}

/**
* function to show sidebar
*/
function showSidebar() {

  // create sidebar with HTML Service
  const html = HtmlService.createHtmlOutputFromFile('Sidebar').setTitle('Sheet Sizer');

// add sidebar to spreadsheet UI
  SpreadsheetApp.getUi().showSidebar(html);
}
There are two functions: onOpen, which will add the custom menu to your Sheet, and showSidebar, which will open a sidebar.
The text between the /* ... */ or lines starting with // are comments.
Step 5:
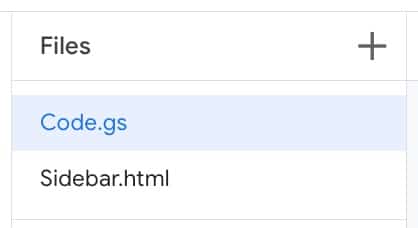
Click the + next to Files in the left menu, just above the Code.gs filename.
Add an HTML file and call it “Sidebar”. It should look like this:
Step 6:
In the Sidebar file, on line 7, between the two BODY tags of the existing code, copy in the following code:
<input type="button" value="Close" onclick="google.script.host.close()" />
This code adds a “Close” button to the sidebar.
Your Sidebar file should now look like this:
<!DOCTYPE html>
<html>
  <head>
    <base target="_top">
  </head>
  <body>

    <input type="button" value="Close" onclick="google.script.host.close()" />

  </body>
</html>
Step 7:
Don’t forget to hit Save
Step 8:
Select the Code.gs file, then select the onOpen function in the menu bar (from the drop down next to the word Debug). Then hit Run.
Step 9:
When you run for the first time, you have to accept the script permissions. If you see an “App isn’t verified” screen, click on Advanced, then “Go to…” and follow the prompts. (More info here.)
Step 10:
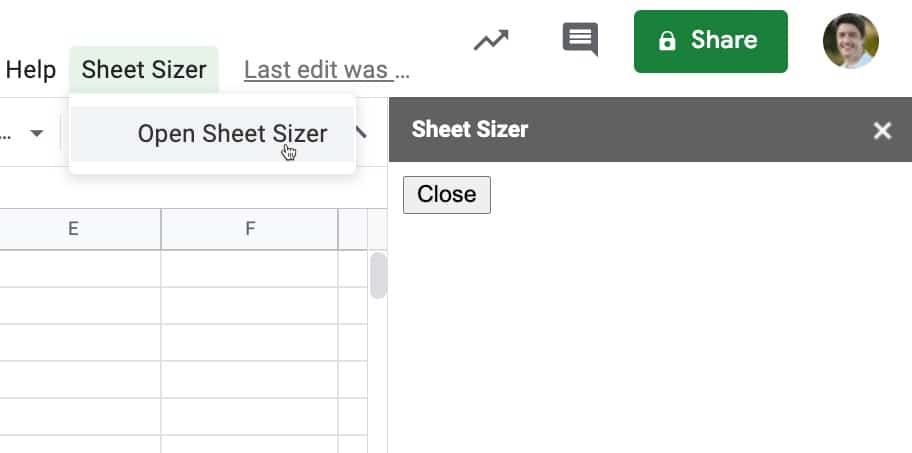
After authorizing the app in step 8, jump back to your Google Sheet. You should see a new custom menu “Sheet Sizer” in the menu bar, to the right of the Help menu.
Click the menu to open the sidebar.
Step 11:
Close the menu using the button.
Here’s what you’ve built so far:
Sheet Sizer: Add a new button and functionality to the sidebar
Step 12:
In the Sidebar file, after the first BODY tag, on line 6, and before the INPUT tag on line 7, add a new line.
Paste in the new button code:
<input type="button" value="Get Sheet Size" onclick="getSheetSize()" />
When clicked, this will run a function called getSheetSize.
Step 13:
Add the getSheetSize function into the Sidebar file with the following code.
Copy and paste this after the two INPUT tags but before the final BODY tag, on line 9.
<script>
function getSheetSize() {

  google.script.run.auditSheet();

}
</script>
When the button is clicked to run the getSheetSize function (client side, in the sidebar), it will now run a function called auditSheet in our Apps Script (server side).
Step 14:
Go to the Code.gs file
Step 15:
Copy and paste this new function underneath the rest of your code:
/**
* Get size data for a given sheet url
*/
function auditSheet() {
  // get Sheet
  const ss = SpreadsheetApp.getActiveSpreadsheet();
  const sheet = ss.getActiveSheet();

  // get sheet name
  const name = sheet.getName();

  // get current sheet dimensions
  const maxRows = sheet.getMaxRows();
  const maxCols = sheet.getMaxColumns();
  const totalCells = maxRows * maxCols;

  // output
  SpreadsheetApp.getUi().alert(totalCells);
}
This gets the active Sheet of your spreadsheet and calculates the total number of cells as max rows multiplied by max columns.
Finally, the last line displays an alert popup to show the total number.
Step 16:
Back in your Google Sheet, run Sheet Sizer from the custom Sheet Sizer menu.
When you click on the “Get Sheet Size” button, you should see a popup that shows the number of cells in your Sheet:
Sheet Sizer: Display the Sheet size in the sidebar
Step 17:
Delete this line of code in the auditSheet function:
SpreadsheetApp.getUi().alert(totalCells);
Step 18:
Paste in this new code, to replace the code you deleted in Step 4:
// put variables into object
const sheetSize = 'Sheet: ' + name +
  '<br>Row count: ' + maxRows +
  '<br>Column count: ' + maxCols +
  '<br>Total cells: ' + totalCells +
  '<br><br>You have used ' + ((totalCells / 5000000)*100).toFixed(2) + '% of your 10 million cell limit.';

return sheetSize;
Now, instead of showing the total number of cells in an alert popup, it sends the result back to the sidebar.
Let’s see how to display this result in your sidebar.
Step 19:
Go to the Sidebar file and copy this code after the two INPUT tags but before the first SCRIPT tag:
<div id="results"></div>
This is a DIV tag that we’ll use to display the output.
Step 20:
Staying in the Sidebar file, replace this line of code:
google.script.run.auditSheet();
with this:
google.script.run.withSuccessHandler(displayResults).auditSheet();
This uses the withSuccessHandler callback function, which we’ve called: displayResults
It runs when the Apps Script function auditSheet successfully executes on the server side. The return value of that auditSheet function is passed to a new function called displayResults, which we’ll create now.
Step 21:
Underneath the getSheetSize function, add this function:
function displayResults(results) {
  // display results in sidebar
  document.getElementById("results").innerHTML = results;
}
When this function runs, it adds the results value (our total cells count) to that DIV tag of the sidebar you added in step 7.
Step 22:
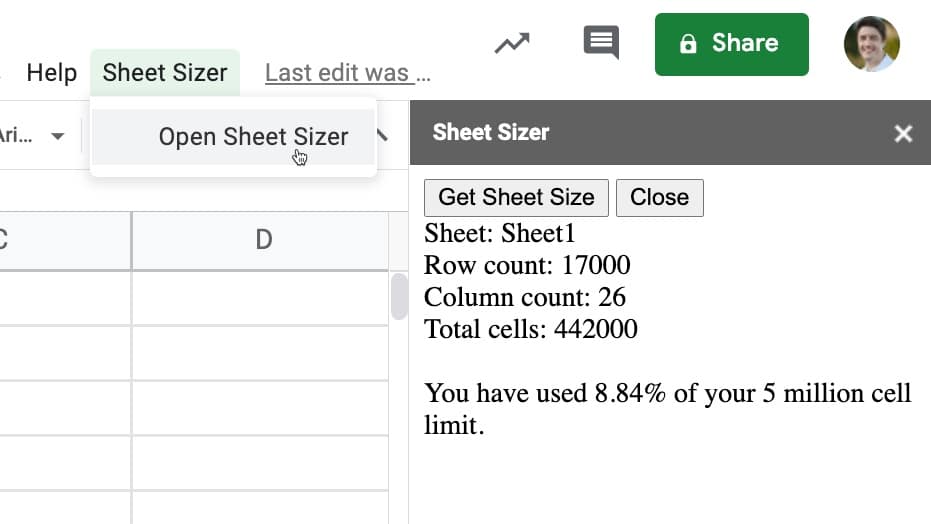
Back in your Google Sheet, run Sheet Sizer from the custom Sheet Sizer menu.
When you click on the “Get Sheet Size” button, you should see a popup that shows the number of cells in your Sheet:
Sheet Sizer: Handle multiple sheets
Step 23:
Modify your auditSheet code to this:
/**
* Get size data for a given sheet url
*/
function auditSheet(sheet) {

  // get spreadsheet object
  const ss = SpreadsheetApp.getActiveSpreadsheet();

  // get sheet name
  const name = sheet.getName();

  // get current sheet dimensions
  const maxRows = sheet.getMaxRows();
  const maxCols = sheet.getMaxColumns();
  const totalCells = maxRows * maxCols;

  // put variables into object
  const sheetSize = {
    name: name,
    rows: maxRows,
    cols: maxCols,
    total: totalCells
  }

  // return object to function that called it
  return sheetSize;

}
Step 24:
In your Code.gs file, copy and paste the following code underneath the existing code:
/**
* Audits all Sheets and passes full data back to sidebar
*/
function auditAllSheets() {

  // get spreadsheet object
  const ss = SpreadsheetApp.getActiveSpreadsheet();
  const sheets = ss.getSheets();

  // declare variables
  let output = '';
  let grandTotal = 0;

  // loop over sheets and get data for each
  sheets.forEach(sheet => {

    // get sheet results for the sheet
    const results = auditSheet(sheet);

    // create output string from results
    output = output + '<br><hr><br>Sheet: ' + results.name +
      '<br>Row count: ' + results.rows +
      '<br>Column count: ' + results.cols +
      '<br>Total cells: ' + results.total + '<br>';

    // add results to grand total
    grandTotal = grandTotal + results.total;

  });

  // add grand total calculation to the output string
  output = output + '<br><hr><br>' +
    'You have used ' + ((grandTotal / 5000000)*100).toFixed(2) + '% of your 10 million cell limit.';

  // pass results back to sidebar
  return output;

}
This adds a new function, auditAllSheets, which loops over all the sheets in your Google Sheet and calls the auditSheet function for each one. The results for each Sheet are joined together into a result string, called output.
Your Code.gs file should now look like this.
Step 25:
Jump back to your Sidebar file and replace this line of code:
google.script.run.withSuccessHandler(displayResults).auditSheet();
with this:
google.script.run.withSuccessHandler(displayResults).auditAllSheets();
The callback function is the general auditAllSheets function, not the specific individual sheet function.
Step 26:
Back in your Google Sheet, add another sheet to your Google Sheet (if you haven’t already) and run Sheet Sizer.
It will now display the results for all the sheets within your Google Sheet!
Sheet Sizer: Add CSS styles
This step is purely cosmetic to make the sidebar more aesthetically pleasing.
Step 27:
Add these CSS lines inside the HEAD tags of the sidebar file:
<!-- Add CSS code to format the sidebar from google stylesheet -->
<link rel="stylesheet" href="https://ssl.gstatic.com/docs/script/css/add-ons1.css">

<style>
  body {
    padding: 20px;
  }
</style>
Step 28:
Add DIV BLOCKS to the elements of the sidebar:
<div class="block">
  <input type="button" class="create" value="Get Sheet Size" onclick="getSheetSize()" />
</div>

<div class="block">
  <input type="button" value="Close" onclick="google.script.host.close()" />
</div>

<div class="block">
  <div id="results"></div>
</div>
Sheet Sizer: Global Variables
Step 29:
One final improvement from me is to move the 10 million cell limit number into a global variable.
Currently, it’s buried in your script so it’s difficult to find and update if and when Google updates the Sheets cell limit.
It’s not good practice to hard-code variables in your code for this reason.
The solution is to move it into a global variable at the top of your Code.gs file, with the following code:
/**
 * Global Variable
 */
const MAX_SHEET_CELLS = 10000000;
And then change the output line by replacing the 5000000 number with the new global variable MAX_SHEET_CELLS:
// add grand total calculation to the output string
output = output + '<br><hr><br>' +
  'You have used ' + ((grandTotal / MAX_SHEET_CELLS)*100).toFixed(2) + '% of your 10 million cell limit.';
Here is your final Sheet Sizer tool in action:
Click here to see the full code for the Sheet Sizer tool on GitHub.
Next steps: have a go at formatting the numbers shown in the sidebar, by adding thousand separators so that 1000 shows as 1,000 for example.