Google Sheets sort by color and filter by color are useful techniques to organize your data based on the color of text or cells within the data.
For example, you might highlight rows of data relating to an important customer. Google Sheets sort by color and filter by color let you bring those highlighted rows to the top of your dataset, or even only show those rows.
They’re really helpful for removing duplicates in Google Sheets too.
As a bonus, they’re really easy to use. Let’s see how:
Google Sheets Sort By Color
Suppose you have a dataset with highlighted rows, for example all the apartments in this dataset:
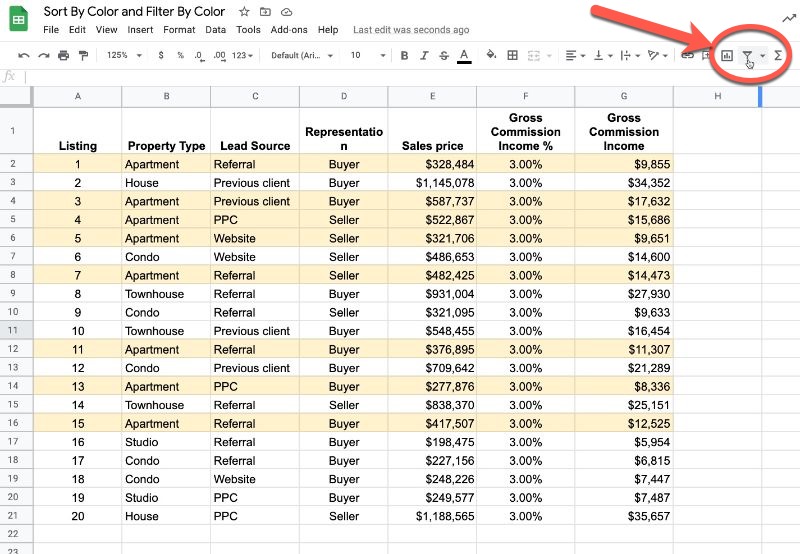
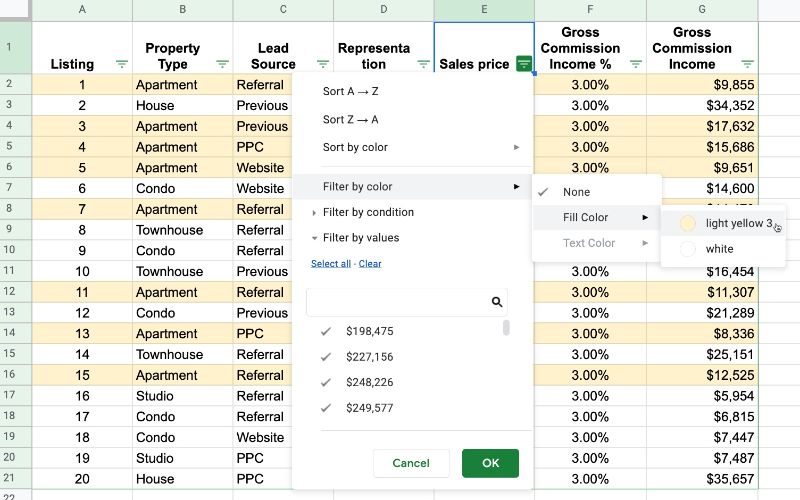
Add a filter (the funnel icon in the toolbar, shown in red in the above image).
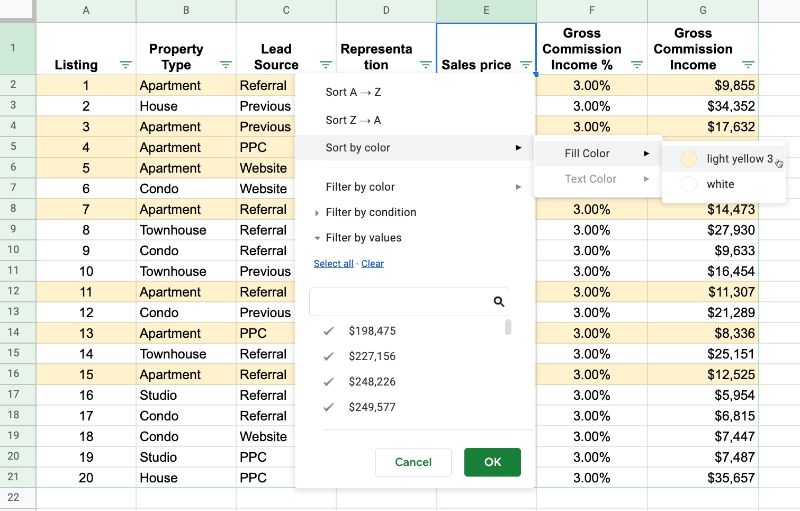
On any of the columns, click the filter and choose the “Sort by color” option.
You can filter by the background color of the cell (like the yellow in this example) or by the color of the text.
The result of applying this sort is all the colored rows will be brought to the top of your dataset.
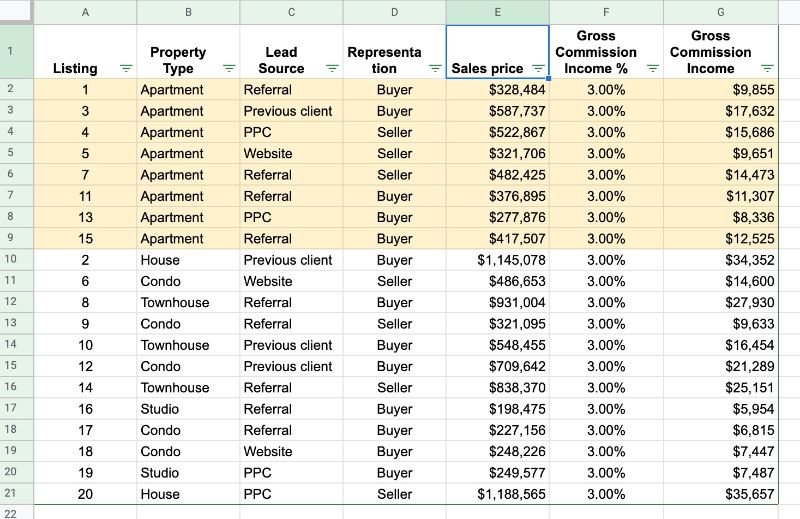
This is super helpful if you want to review all items at the same time. Another reason might be if they’re duplicate rows you’ve highlighted which you can now delete.
Google Sheets Filter By Color
The Google Sheets filter by color method is very similar to the sort by color method.
With the filters added to your dataset, click one to bring up the menu. Select “Filter by color” and then select to filter on the background cell color or the text color.
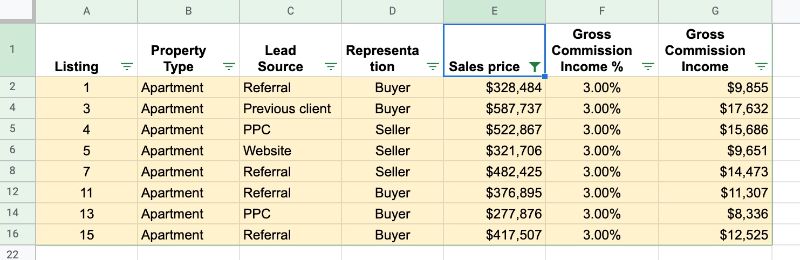
In this example, I’ve used the Google Sheets filter by color to only display the yellow highlighted rows, which makes it really easy to review them.
There’s an option to remove the filter by color by setting it to none, found under the filter by color menu. This option is not found for the sort by color method.
Apps Script Solution
When I originally published this article, sort by color and filter by color were not available natively in Google Sheets, so I created a small script to add this functionality to a Sheet.
They were added on 11th March 2020. Read more here in the Google Workspace update blog.
Here is my original Apps Script solution, left here for general interest.
With a few simple lines of Apps Script, we can implement our own version.
This article will show you how to implement that same feature in Google Sheets.
It’s a pretty basic idea.
We need to know the background color of the cell we want to sort or filter with (user input 1). Then we need to know which column to use to do the sorting or filtering (user input 2). Finally we need to do the sort or filter.
So step one is to to prompt the user to input the cell and columns.
I’ve implemented this Google Sheets sort by color using a modeless dialog box, which allows the user to click on cells in the Google Sheet independent of the prompt box. When the user has selected the cell or column, we store this using the Properties Service for retrieval when we come to sort or filter the data.
Apps Script Sort By Color
At a high level, our program has the following components:
- Custom menu to run the Google Sheets sort by color program
- Prompt to ask user for the color cell
- Save the color cell using the Properties Service
- Second prompt to ask the user for the sort/filter column
- Save the sort/filter column using the Properties Service
- Show the color and column choices and confirm
- Retrieve the background colors of the sort/filter column
- Add helper column to data in Sheet with these background colors
- Sort/Filter this helper column, based on the color cell
- Clear out the values in the document Properties store
Let’s look at each of these sections in turn.
Add A Custom Menu (1)
This is simply boilerplate Apps Script code to add a custom menu to your Google Sheet:
/**
 * Create custom menu
 */
function onOpen() {
  var ui = SpreadsheetApp.getUi();
  ui.createMenu('Color Tool')
        .addItem('Sort by color...', 'sortByColorSetupUi')
        .addItem('Clear Ranges','clearProperties')
        .addToUi();
}
Prompt The User For Cell And Column Choices (2, 4 and 6 above)
I use modeless dialog boxes for the prompts, which allows the user to still interact with the Sheet and click directly on the cells they want to select.
/**
 * Sort By Color Setup Program Flow
 * Check whether color cell and sort columnn have been selected
 * If both selected, move to sort the data by color
 */
function sortByColorSetupUi() {

  var colorProperties = PropertiesService.getDocumentProperties();
  var colorCellRange = colorProperties.getProperty('colorCellRange');
  var sortColumnLetter = colorProperties.getProperty('sortColumnLetter');
  var title='No Title';
  var msg = 'No Text';

  //if !colorCellRange
  if(!colorCellRange)  {
    title = 'Select Color Cell';
    msg = '<p>Please click on cell with the background color you want to sort on and then click OK</p>';
    msg += '<input type="button" value="OK" onclick="google.script.run.sortByColorHelper(1); google.script.host.close();" />';
    dispStatus(title, msg);
  }

  //if colorCellRange and !sortColumnLetter
  if (colorCellRange && !sortColumnLetter) {

      title = 'Select Sort Column';
      msg = '<p>Please highlight the column you want to sort on, or click on a cell in that column. Click OK when you are ready.</p>';
      msg += '<input type="button" value="OK" onclick="google.script.run.sortByColorHelper(2); google.script.host.close();" />';
      dispStatus(title, msg);
  }

  // both color cell and sort column selected
  if(colorCellRange && sortColumnLetter) {

    title= 'Displaying Color Cell and Sort Column Ranges';
    msg = '<p>Confirm ranges before sorting:</p>';
    msg += 'Color Cell Range: ' + colorCellRange + '<br />Sort Column: ' + sortColumnLetter + '<br />';
    msg += '<br /><input type="button" value="Sort By Color" onclick="google.script.run.sortData(); google.script.host.close();" />';
    msg += '<br /><br /><input type="button" value="Clear Choices and Exit" onclick="google.script.run.clearProperties(); google.script.host.close();" />';
    dispStatus(title,msg);

  }
}

/**
 * display the modeless dialog box
 */
function dispStatus(title,html) {

  var title = typeof(title) !== 'undefined' ? title : 'No Title Provided';
  var html = typeof(html) !== 'undefined' ? html : '<p>No html provided.</p>';
  var htmlOutput = HtmlService
     .createHtmlOutput(html)
     .setWidth(350)
     .setHeight(200);

  SpreadsheetApp.getUi().showModelessDialog(htmlOutput, title);

}

/**
 * helper function to switch between dialog box 1 (to select color cell) and 2 (to select sort column)
 */
function sortByColorHelper(mode) {

  var mode = (typeof(mode) !== 'undefined')? mode : 0;
  switch(mode)
  {
    case 1:
      setColorCell();
      sortByColorSetupUi();
      break;
    case 2:
      setSortColumn();
      sortByColorSetupUi();
      break;
    default:
      clearProperties();
  }
}
The buttons on the dialog boxes use the client-side google.script.run API to call server-side Apps Script functions.
Following this, the google.script.host.close() is also a client-side JavaScript API that closes the current dialog box.
Save The Cell And Column Choices In The Property Store (3 and 5)
These two functions save the cell and column ranges that the user highlights into the Sheet’s property store:
/**
 * saves the color cell range to properties
 */
function setColorCell() {

  var sheet = SpreadsheetApp.getActiveSheet();
  var colorCell = SpreadsheetApp.getActiveRange().getA1Notation();
  var colorProperties = PropertiesService.getDocumentProperties();
  colorProperties.setProperty('colorCellRange', colorCell);

}

/**
 * saves the sort column range in properties
 */
function setSortColumn() {

  var sheet = SpreadsheetApp.getActiveSheet();
  var sortColumn = SpreadsheetApp.getActiveRange().getA1Notation();
  var sortColumnLetter = sortColumn.split(':')[0].replace(/\d/g,'').toUpperCase(); // find the column letter
  var colorProperties = PropertiesService.getDocumentProperties();
  colorProperties.setProperty('sortColumnLetter', sortColumnLetter);

}
As a result of running these functions, we have the color cell address (in A1 notation) and the sort/filter column letter saved in the Property store for future access.
Sorting The Data (7, 8 and 9 above)
Once we’ve selected both the color cell and sort column, the program flow directs us to actually go ahead and sort the data. This is the button in the third dialog box, which, when clicked, runs this call google.script.run.sortData();.
The sortData function is defined as follows:
/**
 * sort the data based on color cell and chosen column
 */
function sortData() {

  // get the properties
  var colorProperties = PropertiesService.getDocumentProperties();
  var colorCell = colorProperties.getProperty('colorCellRange');
  var sortColumnLetter = colorProperties.getProperty('sortColumnLetter');

  // extracts column letter from whatever range has been highlighted for the sort column

  // get the sheet
  var sheet = SpreadsheetApp.getActiveSheet();
  var lastRow = sheet.getLastRow();
  var lastCol = sheet.getLastColumn();

  // get an array of background colors from the sort column
  var sortColBackgrounds = sheet.getRange(sortColumnLetter + 2 + ":" + sortColumnLetter + lastRow).getBackgrounds(); // assumes header in row 1

  // get the background color of the sort cell
  var sortColor = sheet.getRange(colorCell).getBackground();

  // map background colors to 1 if they match the sort cell color, 2 otherwise
  var sortCodes = sortColBackgrounds.map(function(val) {
    return (val[0] === sortColor) ? [1] : [2];
  });

  // add a column heading to the array of background colors
  sortCodes.unshift(['Sort Column']);

  // paste the background colors array as a helper column on right side of data
  sheet.getRange(1,lastCol+1,lastRow,1).setValues(sortCodes);
  sheet.getRange(1,lastCol+1,1,1).setHorizontalAlignment('center').setFontWeight('bold').setWrap(true);

  // sort the data
  var dataRange = sheet.getRange(2,1,lastRow,lastCol+1);
  dataRange.sort(lastCol+1);

  // add new filter across whole data table
  sheet.getDataRange().createFilter();

  // clear out the properties so it's ready to run again
  clearProperties();
}
And finally, we want a way to clear the properties store so we can start over.
Clear The Property Store (10 above)
This simple function will delete all the key/value pairs stored in the Sheet’s property store:
/**
 * clear the properties
 */
function clearProperties() {
  PropertiesService.getDocumentProperties().deleteAllProperties();
}
Run The Google Sheets Sort By Color Script
If you put all these code snippets together in your Code.gs file, you should be able to run onOpen, authorize your script and then run the sort by color tool from the new custom menu.
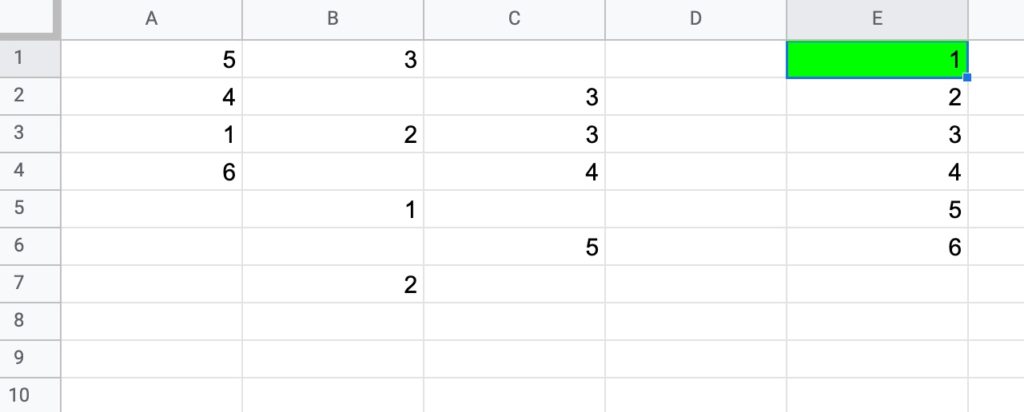
Here’s the sort by color tool in action in Google Sheets:
You can see how all of the green shaded rows are sorted to the top of my dataset.
Note that this sort by color feature is setup to work with datasets that begin in cell A1 (because it relies on the getDataRange() method, which does the same).
Some improvements would be to make it more generalized (or prompt the user to highlight the dataset initially). I also have not included any error handling, intentionally to keep the script as simple as possible to aid understanding. However, this is something you’d want to consider if you want to make this solution more robust.
Apps Script Sort By Color Template
Here’s the Google Sheet template for you to copy.
(If you’re prompted for permission to open this, it’s because my Google Workspace domain, benlcollins.com, is not whitelisted with your organization. You can talk to your Google Workspace administrator about that. Alternatively, if you open this link in incognito mode, you’ll be able to view the Sheet and copy the script direct from the Script Editor.)
If GitHub is your thing, here’s the sort by color code in my Apps Script repo on GitHub.
Apps Script Filter By Color
The program flow is virtually identical, except that we filter the data rather than sort it. The code is almost exactly the same too, other than variable names being different and implementing a filter instead of a sort.
Rather than sorting the data, we create and add a filter to the dataset to show only the rows shaded with the matching colors:
The filter portion of the code looks like this:
// remove existing filter to the data range
if (sheet.getFilter() !== null) {
  sheet.getFilter().remove();
}

// add new filter across whole data table
var newFilter = sheet.getDataRange().createFilter();

// create new filter criteria
var filterCriteria = SpreadsheetApp.newFilterCriteria();
filterCriteria.whenTextEqualTo(filterColor);

// apply the filter color as the filter value
newFilter.setColumnFilterCriteria(lastCol + 1, filterCriteria);
If you want a challenge, see if you can modify the sort code to work with the filter example.
Apps Script Filter By Color Template
Feel free to copy the Google Sheets filter by color template here.
(If you’re prompted for permission to open this, it’s because my Google Workspace domain, benlcollins.com, is not whitelisted with your organization. You can talk to your Google Workspace administrator about that. Alternatively, if you open this link in incognito mode, you’ll be able to view the Sheet and copy the script direct from the Script Editor.)
Or pull the code directly from the GitHub repo here.