I remember handing in my notice seven years ago.
My palms were sweaty.
Several times I walked towards the corner office but turned around, on the pretense of needing to do something else first.
Finally, there was nothing left but to do it.
As I walked, robotically, towards my boss’s office, my pulse quickened and heat rose through my head.
I was so focused on knocking on the door, on willing myself past that point of no return, that when I entered the boss’s office, my carefully rehearsed words spilled out my mouth in a nervous jumble. Words I’d confidently spoken a hundred times in my head.
In my head I had pictured a triumphant scene – the “I quit!” scene – but the reality was a somewhat awkward, anticlimactic conversation.
The news came as a surprise to my boss. He wanted to understand.
“No, it’s not the work…”
“That’s a generous offer to stay, but I’ve made up my mind…”
“I want to focus on getting a job in the tech industry…”
That last statement sounded hollow and vague, even to me.
Did I believe it myself? What did it even mean? I felt the heat rising in my head again.
What will I do next?
Truthfully, I didn’t know.
News traveled fast along the corridors and soon the whole office knew.
Most were incredulous that I would leave a job without a new job to go to. I projected confidence and recited my spiel about wanting to break into the tech industry because it’s my passion.
But in reality, I felt like a vertigo sufferer on a cliff edge, my head swimming.
I was saved by my innermost kernel: my determination to succeed and make a dent in the world.
It’s my most powerful ally, always there to fight my cause. All I had to do was learn how to channel it.
Two weeks later, the change was real and permanent. I woke up and didn’t go to the office. It was a disorientating feeling that took me years to acclimate to.
I spent that summer cycling around the US with my brother, then I got married in the fall. Yet through those joyous events, I carried anxiety, not knowing exactly where my career would go next.
The Wilderness Years: 2014 – 2015
Act 1: A Forensic Accounting Newsletter
My first entrepreneurial idea was to start a paid newsletter for the Forensic Accounting industry, the industry where I’d worked for 8 years and just left.
It didn’t exist, it was specialist knowledge that people would pay for, and my experience qualified me to deliver it.
Paid newsletters are in vogue right now, but not back in 2014. But that was attractive. It added a technology angle to this project: I had to figure out how to deliver and charge for the newsletter.
I spent a month working hard on this idea.
I interviewed people in the industry. I wrote many draft editions of the email. I created a business plan and put together a list of 100 contacts in the industry who would receive the first newsletter.
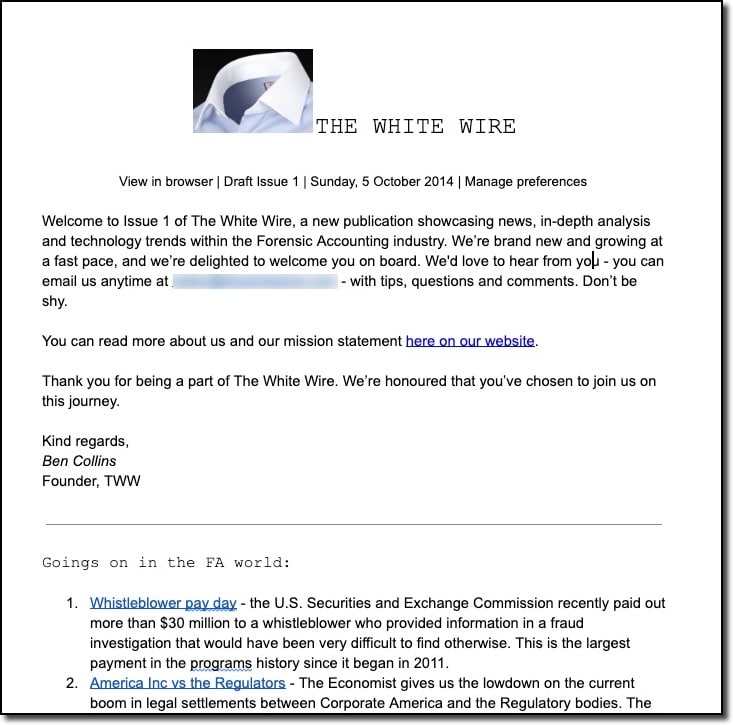
I was just a few days shy of sending the first email when I knew something wasn’t right.
I wasn’t excited by this idea. At all.
In fact, I wanted to get away from the corporate accounting world and blaze my own trail. This wasn’t the solution I was looking for.
I clearly remember the conversation with my wife:
“I can’t do this. I’m not passionate about this industry so I won’t be successful. I’m passionate about the technology around the newsletter and the design of it, but not the contents.”
(By the way, I still think this newsletter is a good idea. Just not a good idea for me.)
It was back to the drawing board.
Act 2: Wannabe Web Developer
I didn’t have another entrepreneurial dream at this stage. But I loved the VBA and SQL coding parts of my old job, so I knew what I wanted to do next.
I wanted to become a developer.
I signed up for a part-time web development course with the education startup General Assembly.
I poured my heart and soul into coding for the next six months.
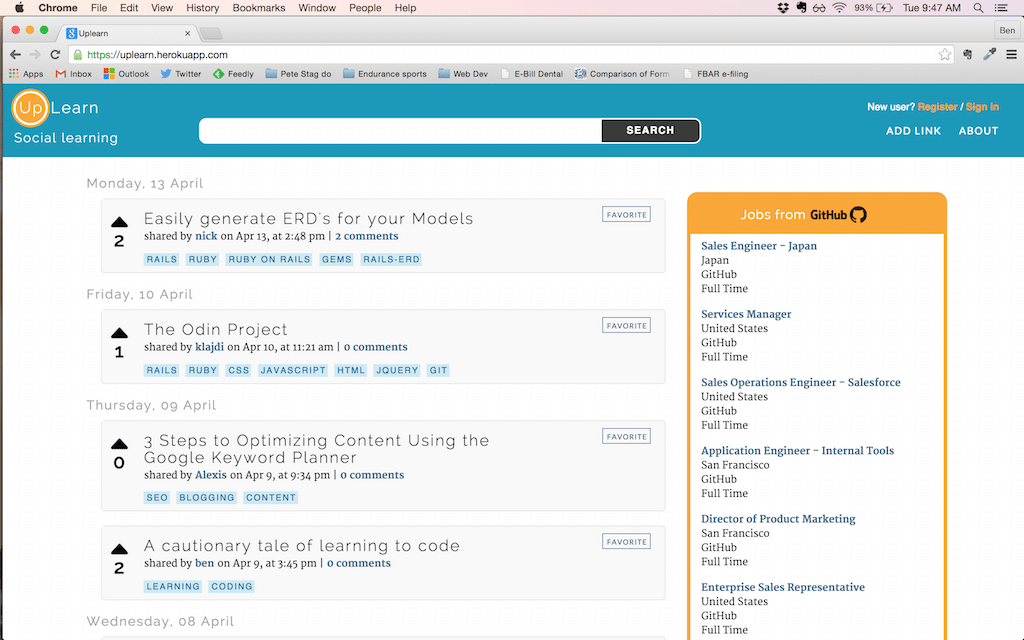
I built a social learning application called UpLearn:
Crucially during this time, I did what every tech job seeker is advised to do and started this blog to share my knowledge.
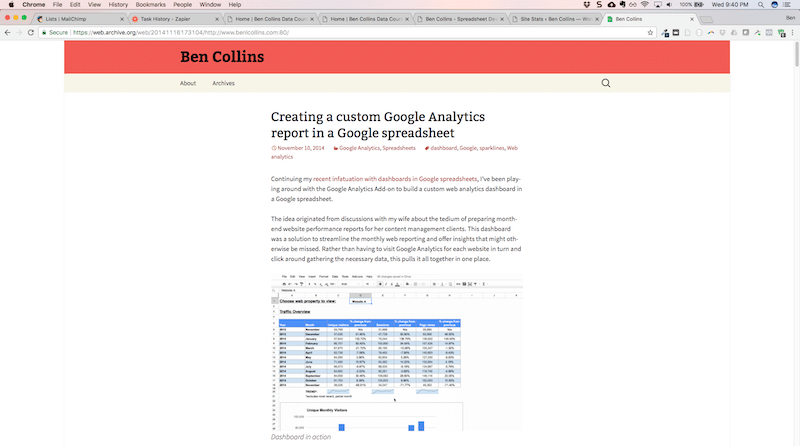
I started the blog as a way to showcase my skills to future employers, not expecting it to become a business in its own right.
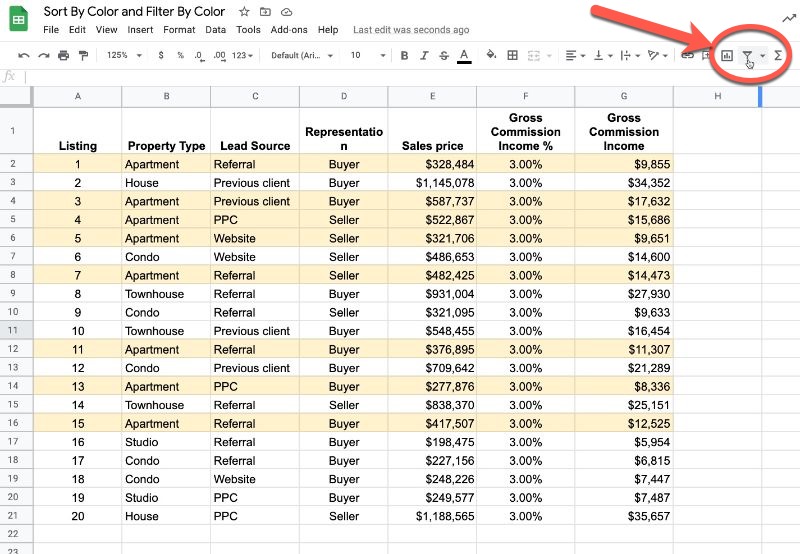
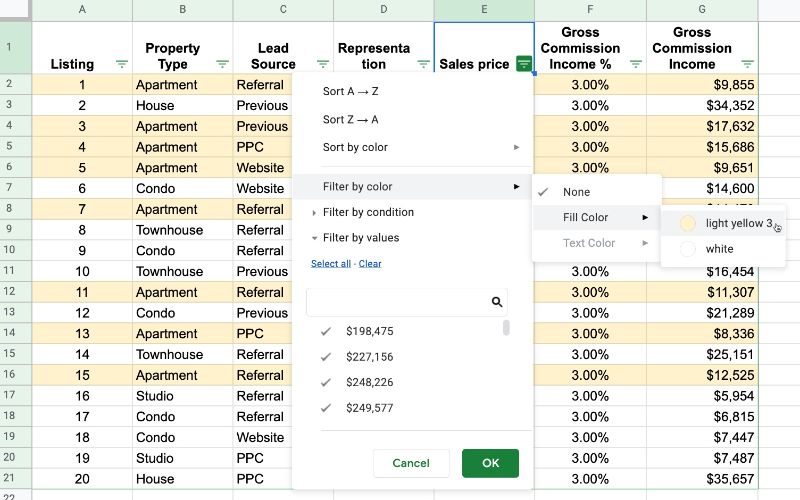
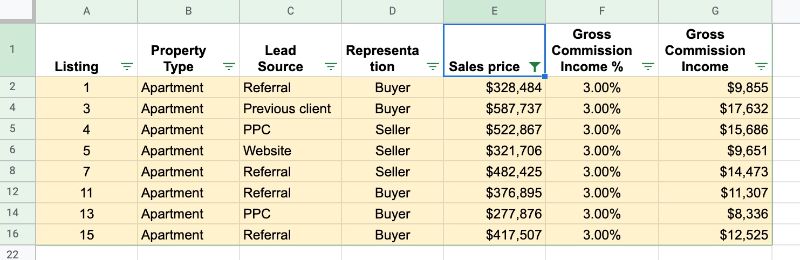
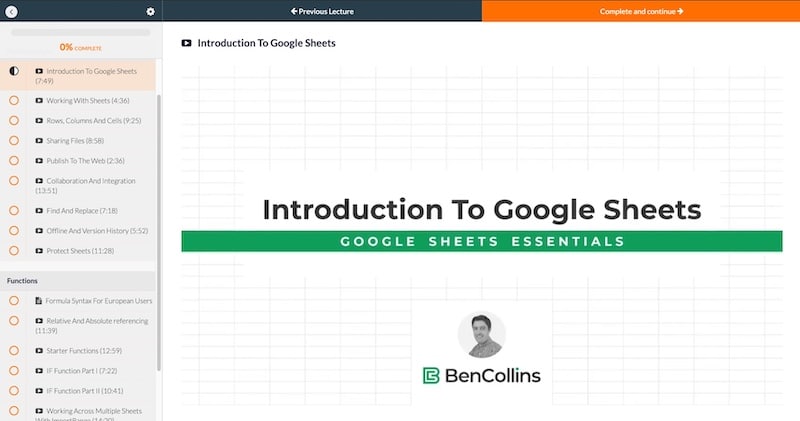
The very first post was about building a dashboard in Google Sheets, published on 31 October 2014.
I started applying for junior web developer roles in the spring of 2015. I applied to 10 positions but didn’t hear back from a single one. Nada. Zip. Not even an acknowledgment of my application.
It was hard to take. I was frustrated. I knew I could do it. Why couldn’t they see this?
I became more and more despondent with each passing day. Act 2 of my own career had yielded nothing either.
Looking back now, this period was full of doubt, as strong as any other time in my life.
Maybe I wasn’t cut out for this. Maybe my destiny was to be a lifetime accountant.
Maybe I could find a way to be happy doing that.
Maybe I should call up my old work again.
But before that happened, the universe sent a lifeline my way…
I got my first inbound client request.
Gaining Traction: 2016 – 2017
Act 3: Freelance Data Analyst
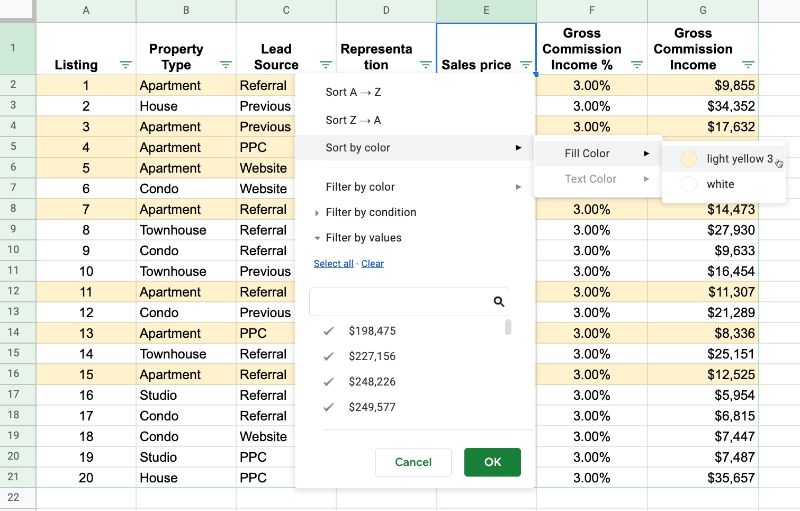
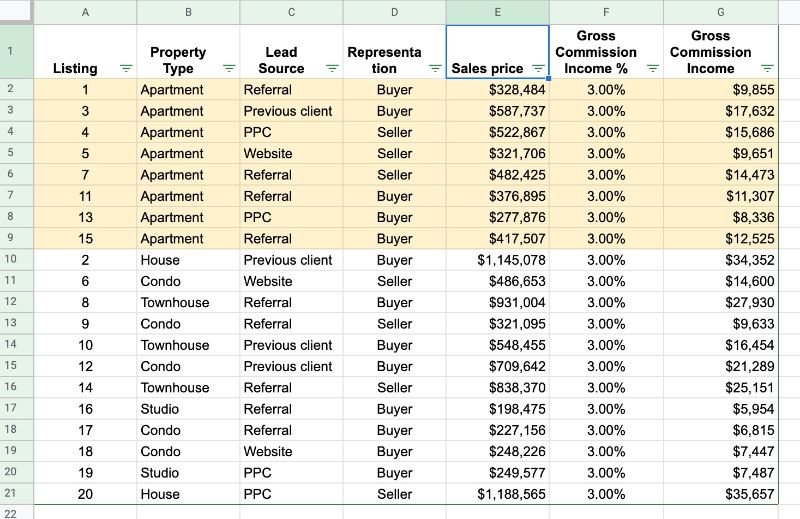
My first client messaged me after reading my Google Sheets dashboard post. He asked if I could build something similar for his real estate business. “Yes, of course!” I said.
Soon a trickle of inbound client work was coming from my website. Projects were all across the board: from Google Sheets dashboards to SQL data analysis to corporate training with Tableau.
It was just enough work to postpone the job hunt and call myself a freelancer.
When General Assembly announced they were looking for instructors for their new Data Analysis course, I applied.
I taught lots of different data analysis courses for General Assembly in 2015 and 2016, from 10-week part-time courses to 2-hour intensives.
Act 4: Freelance Google Sheets Developer
In 2017 I narrowed my focus to data analysis with Google Sheets and Apps Script.
No more Excel, Ruby on Rails, SQL, or Tableau.
I doubled down on the Google Sheets niche. My website traffic increased and the client requests kept rolling in. (See How To Become A Freelance Google Sheets Developer.)
Hardly anyone else was writing about Google Sheets at the time, so it was a huge opportunity.
I was intimately familiar with the cottage industry built on the back of Microsoft Excel – consultants, course creators, bloggers – so I reasoned there was a good chance something similar would exist for Google Sheets years from now.
And I intended to be at the forefront of that industry.
Act 5: Course Creator
For years, I’d contemplated the idea of creating an online course, inspired by the Excel gurus like Chandoo, who made their living teaching spreadsheets.
In mid-2016 I committed to creating a Google Sheets course. Just one. I would give it a try and see what happened. If it was successful, then I could do it again. If not, then no problem, I could keep going with my freelance consulting.
I chose Dashboards as the first-course topic. I’d seen good traction on those posts on my website so I knew it was something people wanted to learn.
It took me about six months – alongside my existing consulting work – to create the dashboards and record the lessons, making many mistakes along the way.
I finally launched the Google Sheets Dashboard course in February 2017:
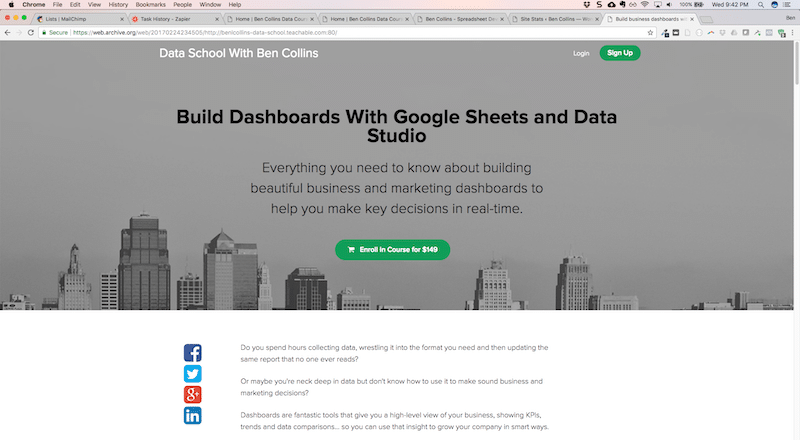
I made $7,000 in the week I launched the course, to an email list of around 2,000.
To me, it was a huge success. Certainly enough to convince me to create a second course.
I recorded and launched a Data Cleaning course – now part of the Data Analysis course – between March and May 2017. I was incentivized to finish this one because my second son was born at the end of May.
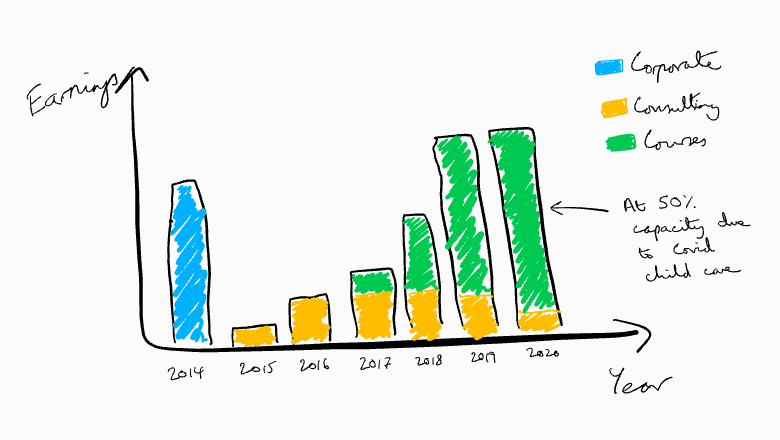
Building a Business: 2018 – 2020
By the end of 2017, I was making a modest salary from my business. But it was still some way short of my old corporate earnings.
I still struggled with the process of working for myself. In my previous jobs, I’d always had a boss (or drill sergeant) telling me what to do next.
Now I was on my own.
And I clearly needed help building good work habits so I could scale my business. I felt like I started from scratch with each new client project. I had no systems in place. I didn’t have a consistent pricing methodology.
After much encouragement from my wife, who has her own entrepreneurial experience, I hired a business coach.
My new business coach was immediately helpful.
She brought discipline to my work.
She taught me how to evaluate opportunities. How to sell my work. How to write convincing marketing copy.
And she helped me start a weekly Google Sheets tips newsletter in April 2018, which has grown to be one of the fundamental pillars of my business.
If you’re thinking about hiring a business coach, do it. It’s one of the best investments you can make for your business and yourself.
In 2019, Google invited me to be part of the Google Developer Expert program, as recognition of my work on Google Sheets and Apps Script. This has been an amazing community to be a part of. I’ve enjoyed working closely with other members and Google team members.
Act 6: Growing The Online School
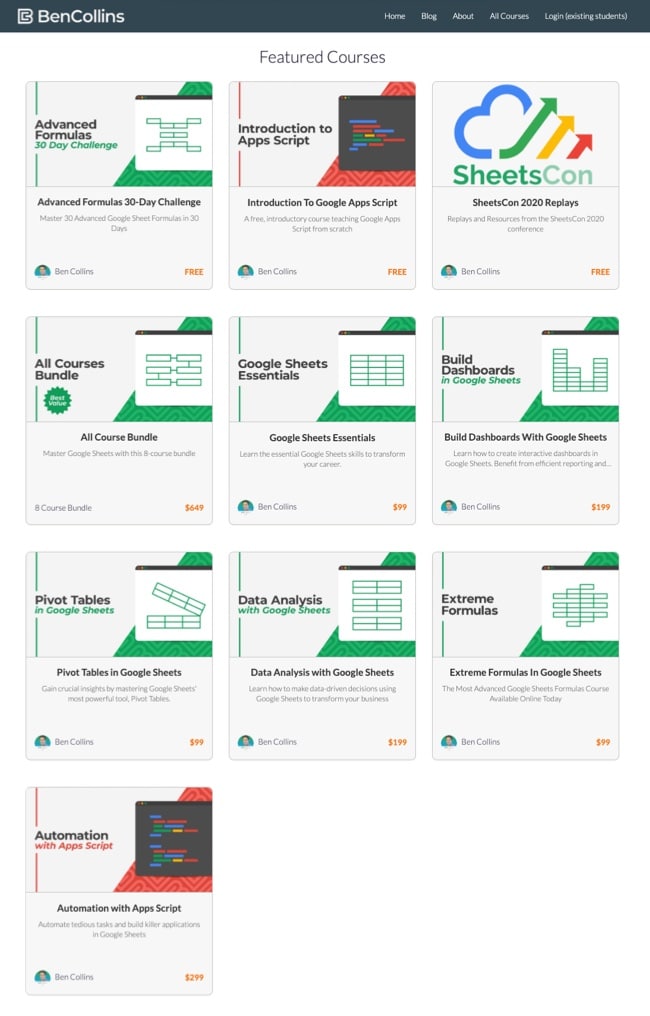
Between 2018 and 2020, I released a whole series of online courses. They sold well.
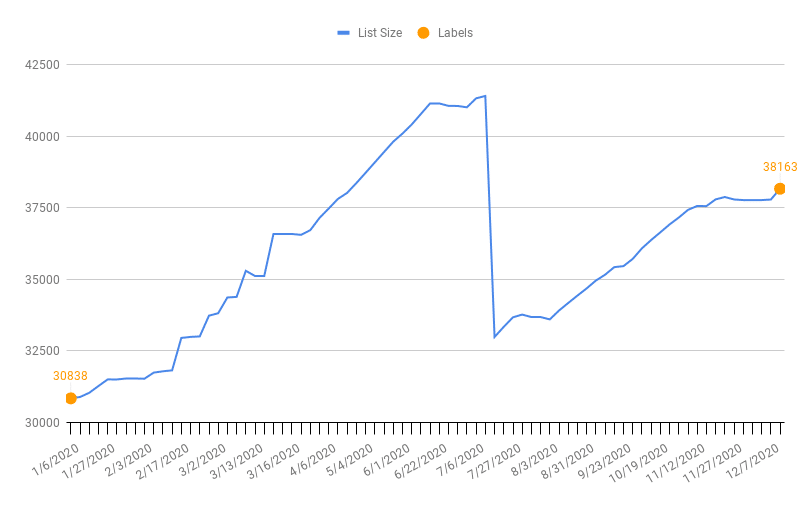
My email list had grown to around 30,000 by mid-2020, largely because of people signing up to my free Advanced Formulas course and my Introduction to Apps Script course.
Most importantly, I’ve kept up my weekly newsletter habit, started in 2017, so that my audience is engaged and familiar with me and my course offerings.
But my courses looked amateur because I’d created all the graphics myself. And I knew the recording quality could be improved.
So my big goal for 2020 was to update the entire catalog.
At the beginning of 2020 I hired a design firm to create a new brand for this site and my courses.
I then embarked on a journey to overhaul every course in my catalog. I thought it would take me six months.
But the pandemic hit…
Work hours were reduced as I shared child care with my wife, who also has a career to sustain.
In the end, it took me a year to complete the course updates (not full-time). I uploaded the last video for the Automation With Apps Script course in late February 2021, complete with professional branding.
The Future: 2021 onwards
Now, in March 2021, my business is at an inflection point.
These are always fascinating times for an entrepreneur.
You’re reinventing yourself again. Starting over. Shedding your skin.
My existing online courses generate a six-figure profit annually, more than I used to make at my corporate job at a law firm.
But it’s time for me to grow again. Online education is evolving and some students crave more than on-demand courses alone can provide.
With the shift to zoom-first work culture in the past year, live training courses, often called Cohort-Based-Courses (CBCs), have exploded in popularity.
It’s not hard to understand why. Traditional on-demand online courses only work for the most motivated students, ones who have the discipline (and time!) to sit down and work through the content.
What the on-demand courses lack is accountability and community, two aspects that deliver huge benefits to students.
And that’s where these next-gen cohort courses come in. They offer you that accountability and community, as well as direct access to the expert teachers behind the videos. They’re a step closer to in-person training, combined with the convenience of remote learning.
I’m working on a new cohort course, called Pro Sheets Accelerator. It’s a five-week course, meeting twice a week for a 90-minute live session, plus office hours, community and a capstone project.
I’m really excited to bring this to life and share more details over the coming weeks.
My online, on-demand course library, now fully updated, remains available for students who prefer to learn that way. But this new live format course offers more opportunities for students to learn, grow and support each other.
Shifting my energy to this live cohort course model feels like a tipping point that will propel me forward to bigger things.
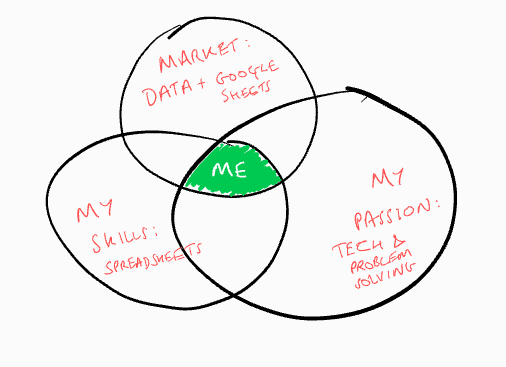
It took me years to get to this point, to find that sweet spot where my skills and experience matches what the market is looking for. Along the way, I’ve built an engaged audience of folks who can benefit from my work.
The first cohort of my live training course, Pro Sheets Accelerator, is just the beginning of this next Act.
My mission is to create a world-class online school, teaching productivity, data analysis, and workflow automation, using Google tools.
Onward and upward!
Ben Collins, March 2021