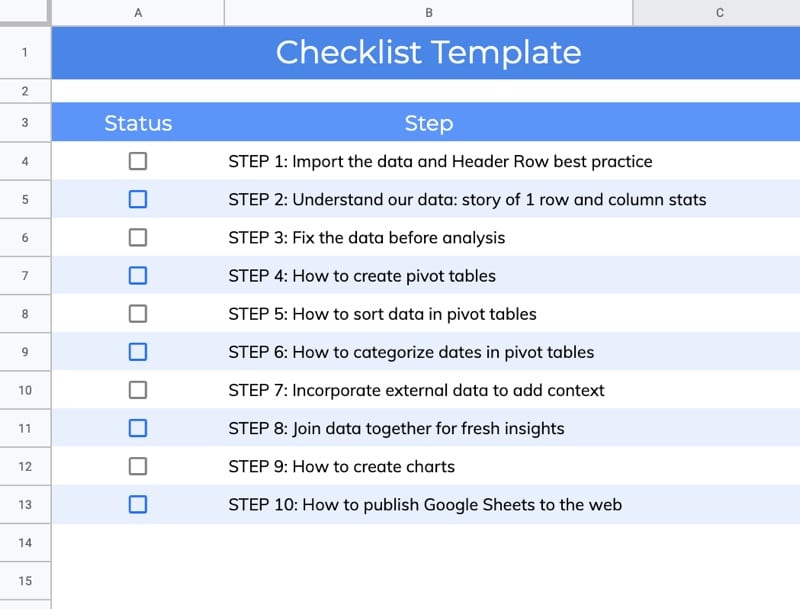
In this post, you’ll learn how to alternate colors in Google Sheets and add row or column banding to your data tables.
Here’s an example of alternating row bands applied to a checklist in Google Sheets:
Educator and Google Developer Expert. Helping you navigate the world of spreadsheets & AI.
In this post, you’ll learn how to alternate colors in Google Sheets and add row or column banding to your data tables.
Here’s an example of alternating row bands applied to a checklist in Google Sheets:
The TRIM function in Google Sheets removes unwanted spaces around text.
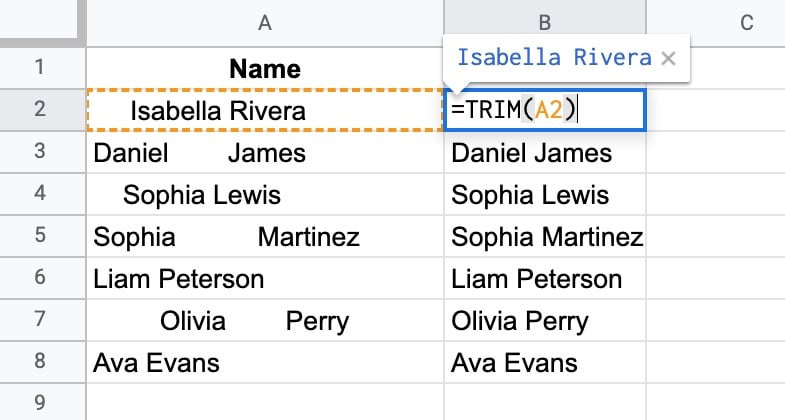
TRIM removes the leading, trailing, and repeated spaces in the text values in column A.
The formula is:
=TRIM(A2)🔗 Get this example and others in the template at the bottom of this article.
Continue reading How To Use The TRIM Function In Google Sheets To Clean Your Data
Barcodes are visual representations of numbers and strings.
Typically they represent numbers that link back to records in a database storing valuable information about a product.
They’re easy for machines to scan and are ubiquitous in stores and warehouses around the world.
Learn how to create barcodes in Google Sheets in this post, with a simple 2-step process.
Continue reading Create Barcodes In Google Sheets In 2 Easy Steps
║█║▌║█║▌│║▌║▌█║
In this post, I want to show you something amazing: how a simple equation — the logistic map — can lead to incredible outcomes, and even to chaos.
And we’ll explore this with Google Sheets so you can follow along (please download the template at end of the post).
But first, we begin our story in a field far, far away, where two bunnies are getting down to, erm, business, shall we say, as they start a fluffle* of rabbits…
* collective noun for wild rabbits

Provided the growth rate is greater than one, the population grows until it becomes constrained by limited resources (for example, food). Then it settles into a stable population, neither increasing nor decreasing year on year.
But as the growth rate increases weird things start happening.
The rabbit population grows faster but it doesn’t settle down to a single equilibrium (stable population) anymore. No. In fact, the population oscillates between two equilibrium values. One year high, one year low, then back to the high value again, then low, and so on, to infinity.
Keep increasing the growth rate, however, and suddenly the population oscillates between four equilibriums. Then eight. Then sixteen.
And if it increases past the specific growth rate of 3.57, well all bets are off the table!
The population becomes chaotic and never settles into any equilibrium at all. It bounces around randomly, some years high, others low, others in the middle, with no pattern.
Except that’s not the end of the story.
Incredibly, within this region of chaotic behavior lie “islands of stability”. Short windows at specific growth rates where order re-establishes itself.
Out of the chaos, a periodic pattern emerges! 🤯
Here is the logistic map with a changing growth rate to illustrate how the population changes:
This post is a summary of common authentication protocols for API authentication with Apps Script.
I got fed up digging around in my Drive folder for old scripts to refresh my memory on the syntax, so I created this reference.
It’s not a comprehensive post on how to connect to APIs, instead, it’s a short summary of common protocols for easy reference.(If you’re new to APIs, start with my Apps Script API tutorial for beginners.)
This post looks at four different API authentication methods: