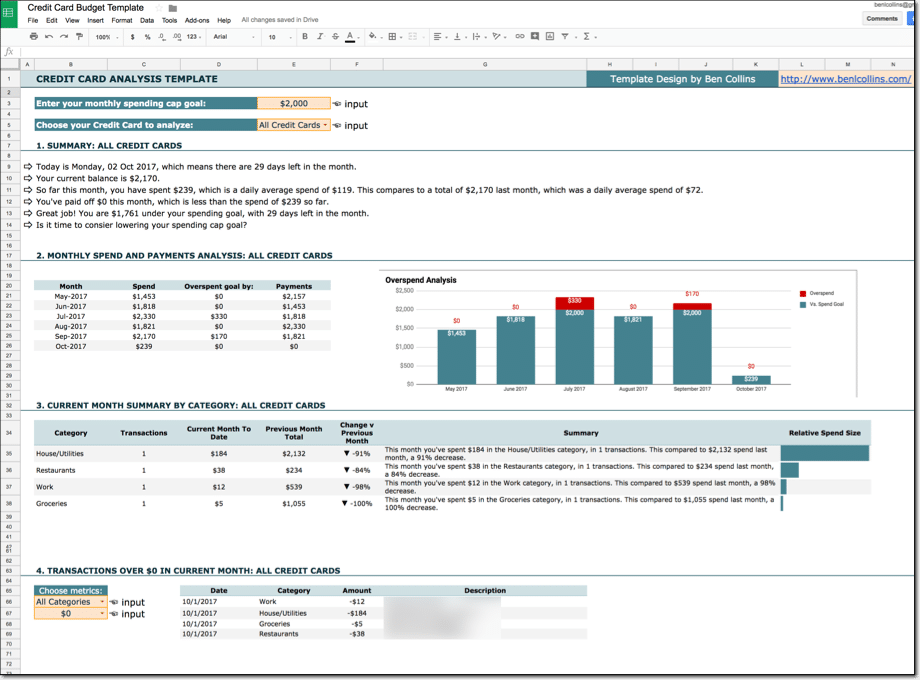
Excel tutorial: build a dynamic bump chart of the English Premier League

Premier League team performance

Find your team: See the history of each of the 47 teams in the Premier League here.

In this post I’ll show you how to create a dynamic bump chart like the one above, using historical data for the English Premier League going back to 1992-93 when it was created.

Continue reading Excel tutorial: build a dynamic bump chart of the English Premier League

Save time with this custom Google Sheets, Slack & Email test scoring bot

You’ve marked your students’ test scores and recorded it all in a beautiful Google Sheet.

You’ve dotted your i’s and crossed your t’s, checked your spelling, and made sure all your scores are ready to go.

Now comes the tedious part, copying and pasting each student’s scores and feedback into an email or Slack message to send back to them.

Wait, there’s a better way!

With a little bit of upfront effort using Google Apps Script, you can build yourself a custom Google Sheets Slack/Email app that can automate that whole final step for you.

Besides being useful, it’s also pretty fun to post stuff from your Google Sheet direct to Slack!

Google Sheets Send To Slack

Continue reading Save time with this custom Google Sheets, Slack & Email test scoring bot

Create A Dynamic Chart In Google Sheets With A Drop-Down Menu

In this post, I’ll show you how to create dynamic charts in Google Sheets, with drop-down menus.

I get lots of questions on how to add interactivity to charts in Google Sheets. It’s a great question that’s worthy of a detailed explanation.

Dynamic charts can really enhance reports and dashboards, allowing for more information to be conveyed in the same amount of screen space. This article will show you how to use the data validation method to make a Google Sheets drop-down menu to control a dynamic chart.

Continue reading Create A Dynamic Chart In Google Sheets With A Drop-Down Menu

10 Techniques for building a Google Sheets Dashboard

You’re probably familiar with using Google Sheets to organize and analyze your data. But did you know you can build a dynamic Google Sheets dashboard to really understand your data?

With a handful of powerful techniques, you can add some pizzazz and dynamism to the presentation of your data. Here are ten tricks to try next time you’re building a Google Sheets dashboard.

Continue reading 10 Techniques for building a Google Sheets Dashboard

Creating a dynamic dashboard in Google Spreadsheets to track sales for a digital product launch

This article covers how to build a dynamic dashboard in Google Sheets, using formulas and data validation methods so that charts change dynamically based on user input.

This post is based on work I did in 2015 with The Write Life team to develop some behind-the-scenes sales data analysis during their 3-day digital bundle sale. The team wanted a simple way of gauging progress and seeing how the different sales channels fared as the sale took place.

Here’s the final dynamic dashboard:

dynamic dashboard in action
Interactive sales dashboard in a Google spreadsheet
Want your own copy of this dashboard?
Click here to access your copy of this template >>

Continue reading Creating a dynamic dashboard in Google Spreadsheets to track sales for a digital product launch